The efficient-market hypothesis says a stock’s price fully reflect all available information. It is called Random Walk Theory which also means market prices should only react to new information or changes in discount rates.
By discounting, it means if market assumes the result of a company is positive; it appreciates it but if the results is lower than expected; price falls and re-adjusts; You can see many major companies falling after good news or going up because of good news).
This lead to Random Walk Theory which says stock market prices walks randomly. So how it will help the traders?
This is a data science problem!
Is there something we could do to predict future stock prices given that we have past prices. No, price action is “serially independent.” This means that price history is not a reliable indicator of future price action. Technical indicators take past points to indicate what may happen next. But what works?
Machine Learning
It creates predictive models. You can see an amazing video here on it –
Probabilistic Extrapolation Models
In our slack forum, there is a strategy named Buddha developed by a fellow trader which shoots trades based on probability only and extrapolating candle data of open, high, low, close.
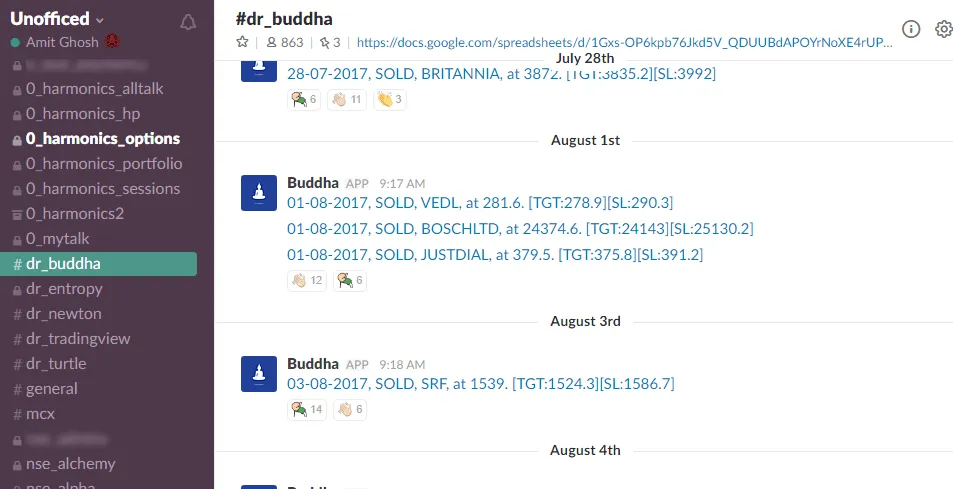
It was throwing order live since a couple of months. You may want to check it the past results –
We can not backtest it as we are unsure how to backtest a strategy which changes itself. There are also many awesome extrapolation models which work based on probability. Also, you don’t need more than 50% win ratio to win. Check here for more details on Buddha.
Let’s say a strategy with risk: reward of 1:5. You lose 10 INR on losing trades and wins 50 INR on winning trades. Your chance of winning is 40%. It is a profitable strategy! It’s all about finding order within chaos.
Fibonacci Price Patterns
In the financial markets, history has proven that within this randomness there is a degree of repetition. Once a potential pattern is identified, the trading opportunity can be managed according to a defined set of rules that are particular to each situation.
In the financial markets, history has proven that within this randomness there is a degree of repetition. Once a potential pattern is identified, the trading opportunity can be managed according to a defined set of rules that are particular to each situation.
Harmonics is one such methodology which focuses on Fibonacci ratio alignments. TradingView is a hub of chartists where most traders are price pattern maestros.
Here are some trade examples of Harmonics –
Past examples – (Just click the play button. It gives a verified track record of the trades posted which will differentiate real trades and affiliates)
There are amazing people to follow there too. If you really loving trading, check up there.
Related Posts