Candlesticks or Japanese Candlesticks were developed by a rice trader in the 18th century. This knowledge was hidden to the western world until Steve Nison wrote a book on it some 20 years ago.
Line charts were very popular because they gave a clear picture of the trend. However, they don’t show a complete picture. They don’t disclose what happened on a particular day. A line chart is 1 dimensional. A mere DOT.
This is where Japanese Candlesticks gain importance. They show the psychology of what happened on a particular day. In trading, gauging the psychology is of utmost importance. A candlestick will give you information about what is happening and what might probably happen. if candlesticks are analyzed in a proper way then the likelihood of knowing what will happen in the near future is very high. Candlesticks also act as informers. They inform when an upswing or downswing has ended.
Let’s begin with the basic structure of a candlestick.
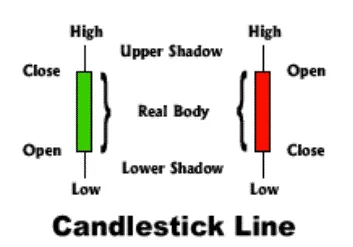
Candles have a body, tail and a wick. The upper shadow is called as the wick and the lower shadow as the tail.
Depending on how the movement of the stock was on a particular day, the color can be green or red.
Eg. If the stock opens at 100 and closes at 105, the candle’s body will be green.
If the stock opens at 100 and closes at 95, the candle’s body will be red. Now I shall post a picture showing how to convert a line chart into a candlestick.
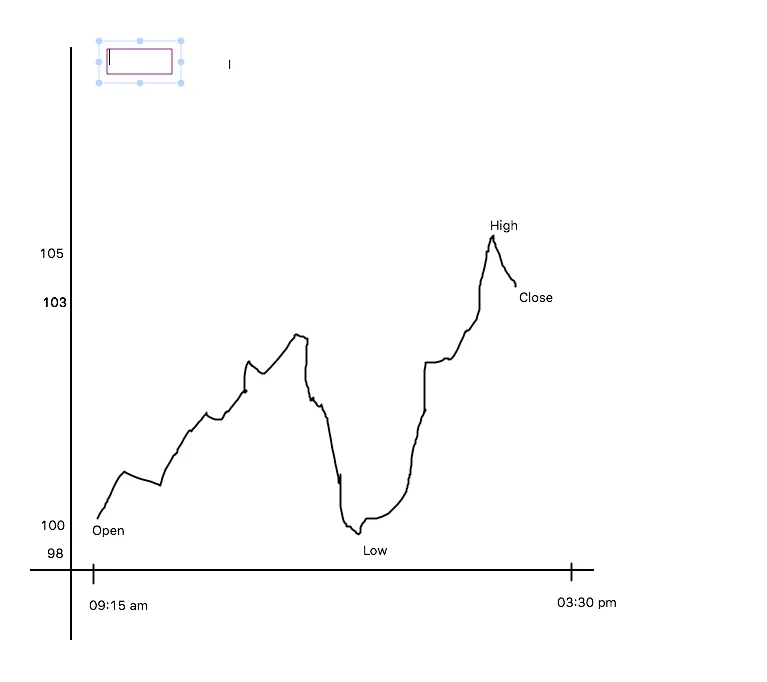
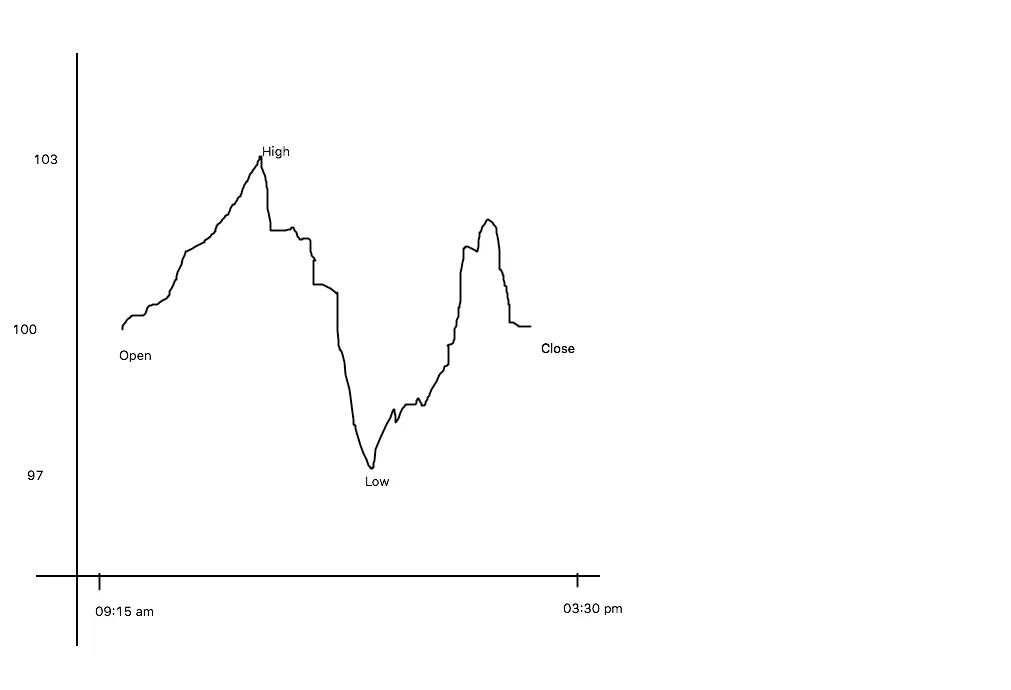
This is an intraday chart. The open high low and close are mentioned. Now the first activity will be to convert this chart into a candlestick.
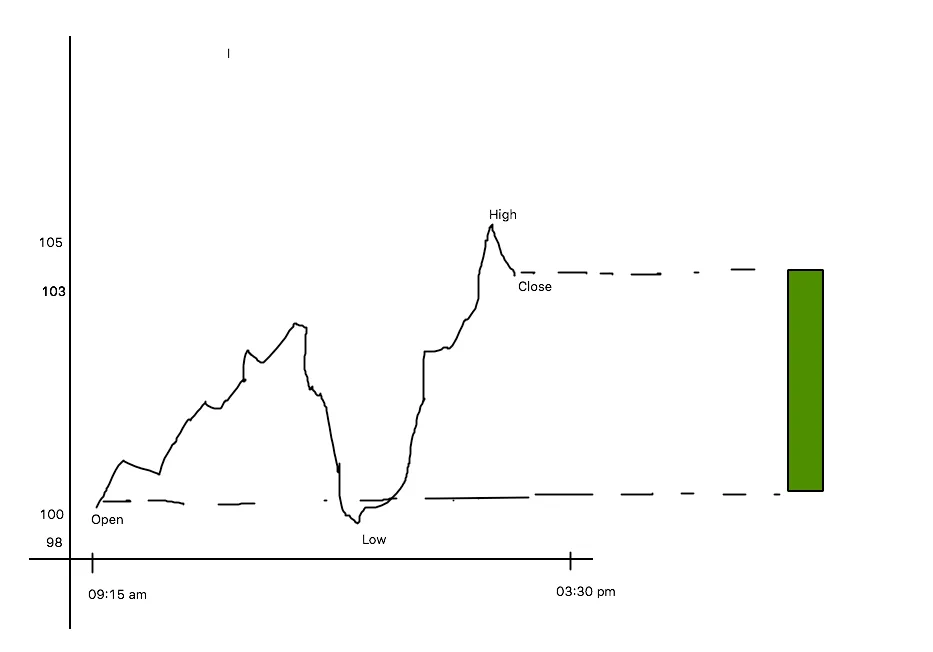
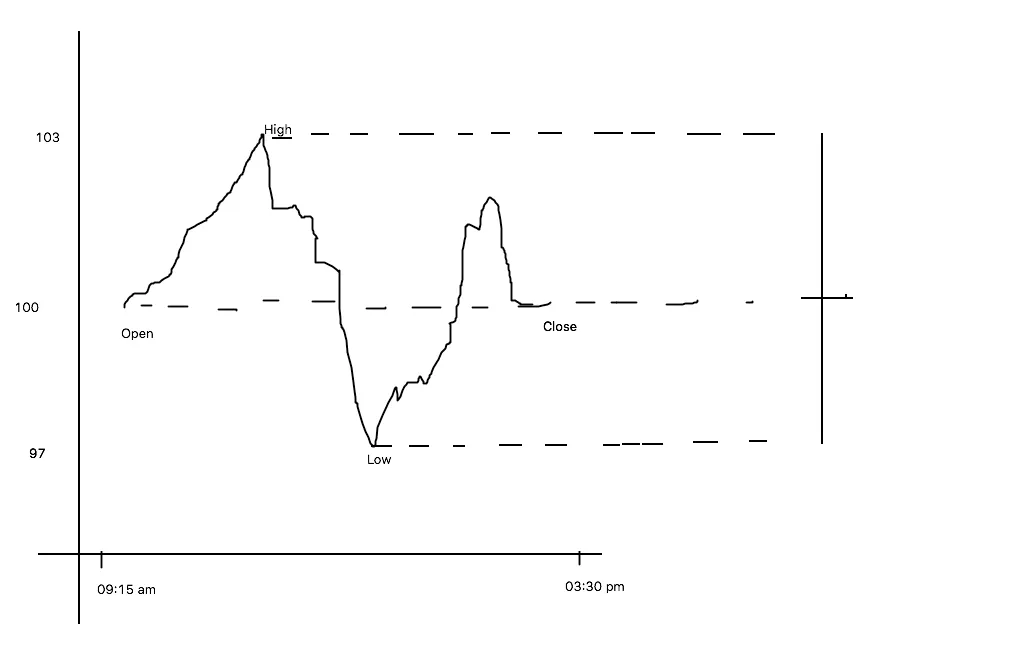
Step 1: Project Open and Close on the right side to get a range of the body.
The color is green because of Close > Open. Now that we have the real body, we will make use of the High and Low to complete the candlestick.
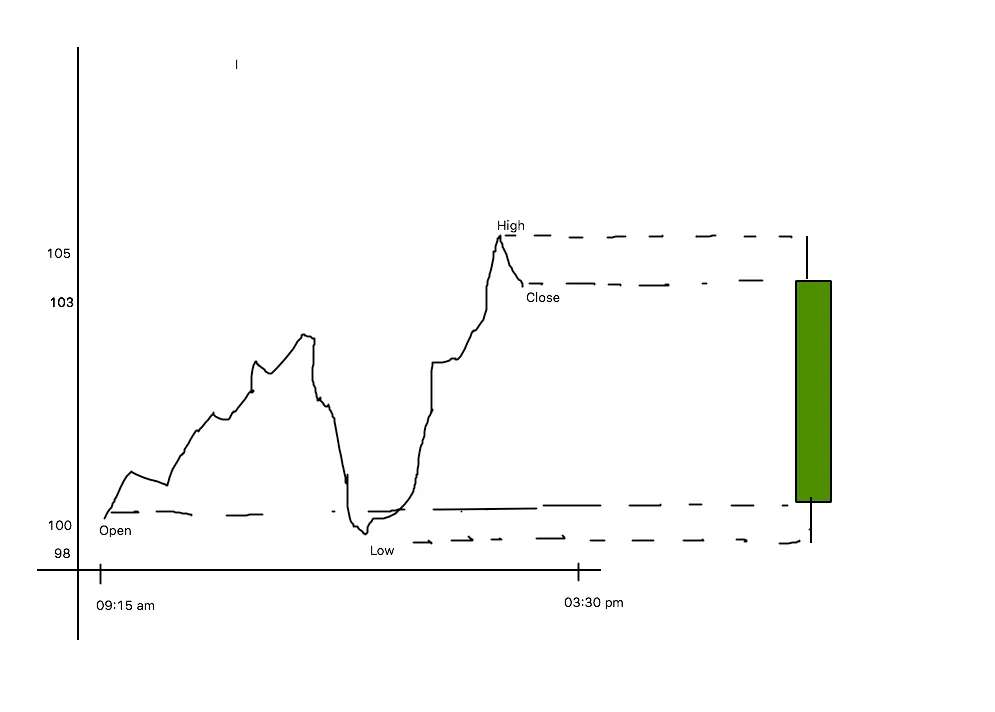
Step 2: Project the high and low to get the Wick and the Tail respectively. Always remember, the wick is formed with the high and tail with the low. Now similarly, I shall make an illustration with a red candle.
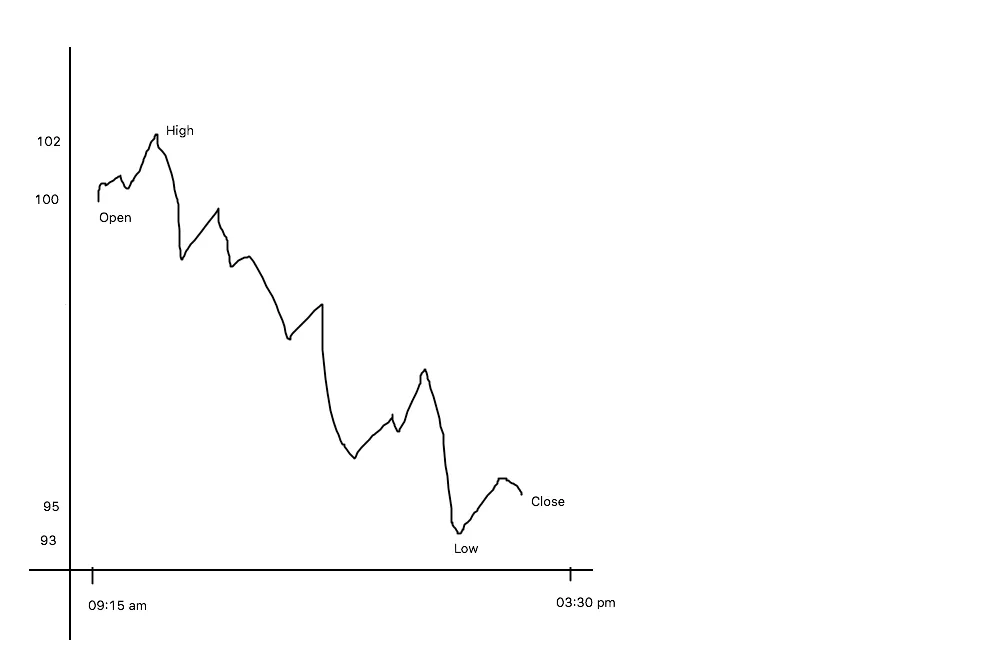
This is an intraday chart where the price just went down. The body will be a red one. The next diagram will bear its description.
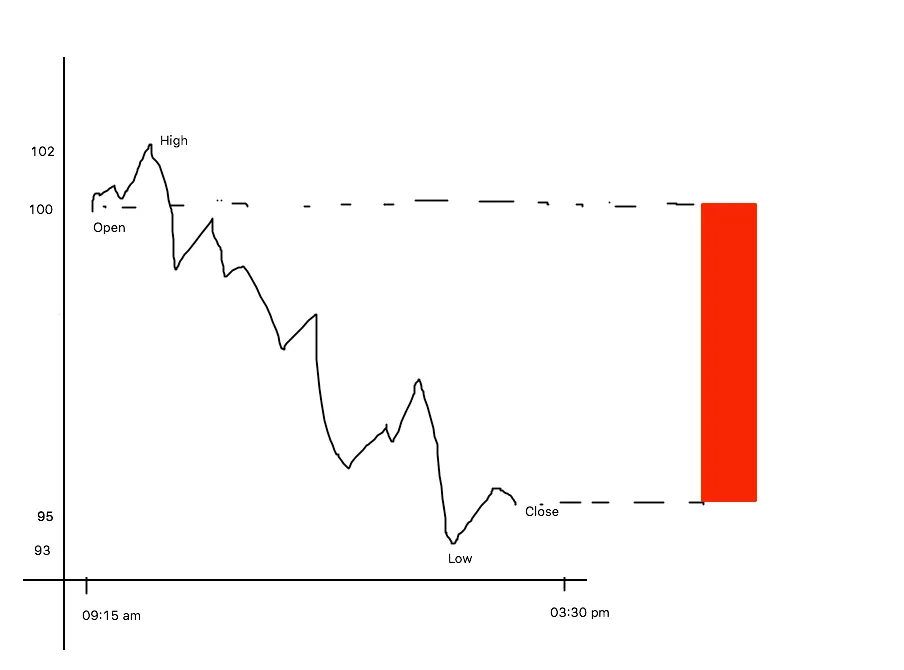
As usual, Step 1 will be projecting the open and close to get the body of the candle. In this case, open at 100 and close at 95 makes the body red.
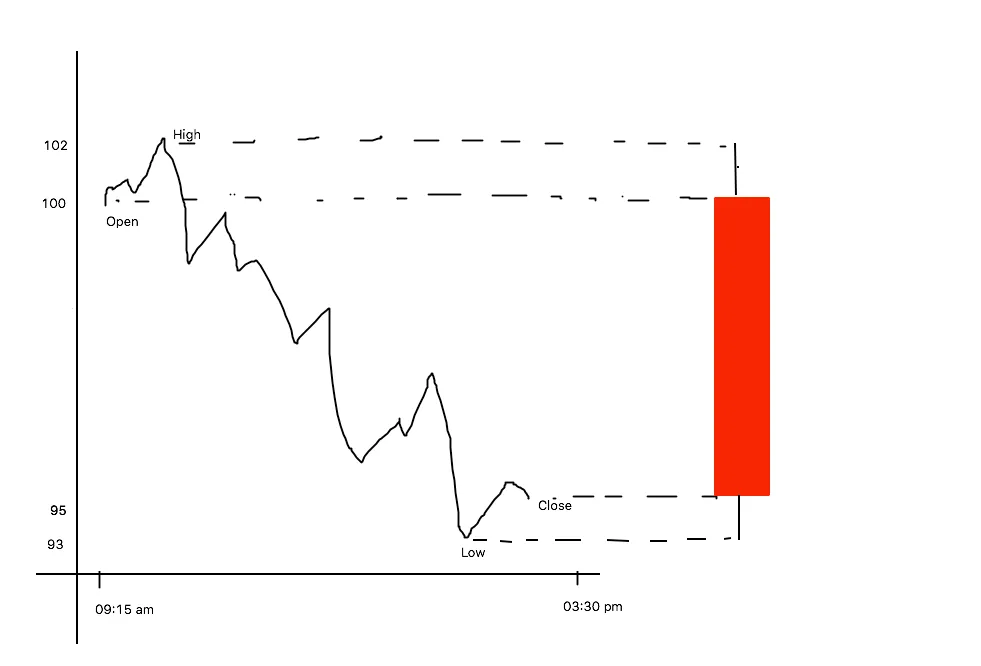
Step 3: Project the high and low to make the wick and tail. I will now take an exceptional case where there is no body in the candlestick. Just a skeleton with highs and lows.
This happens on a confusing day. You might hear the following things from traders ” Market has no direction today / Mazza Nahi aa Raha market mei confuse kar Diya / Stop losses have hit both sides, the market is unpredictable ”
This is an exceptional case where the market is clueless about its direction and the keywords to define the market will be ” Directionless “, ” Confused “, ” Unpredictable”, ” Sideways”
The stock opened and closed at the same level! On such a day, uninformed traders get slaughtered. Candlesticks have certain names (English and Japanese) and such a candlestick is called as a “strong>DOJI”. So remember, either the market is green, red or DOJI- which means confused. With this basic information, you can make any kind of candlestick in the world and you will be able to read what happened on a particular day, something a line chart trader can’t even imagine of doing. This puts you all in a superior position. After your eyes are trained, it will take 2-3 seconds to just find out what happened and what will happen. In short, you will understand the psychology of the market and make an informed decision at a lightning fast speed. I shall take 4 different candlesticks types and their trading setups.
1. Hammer and Shooting Star
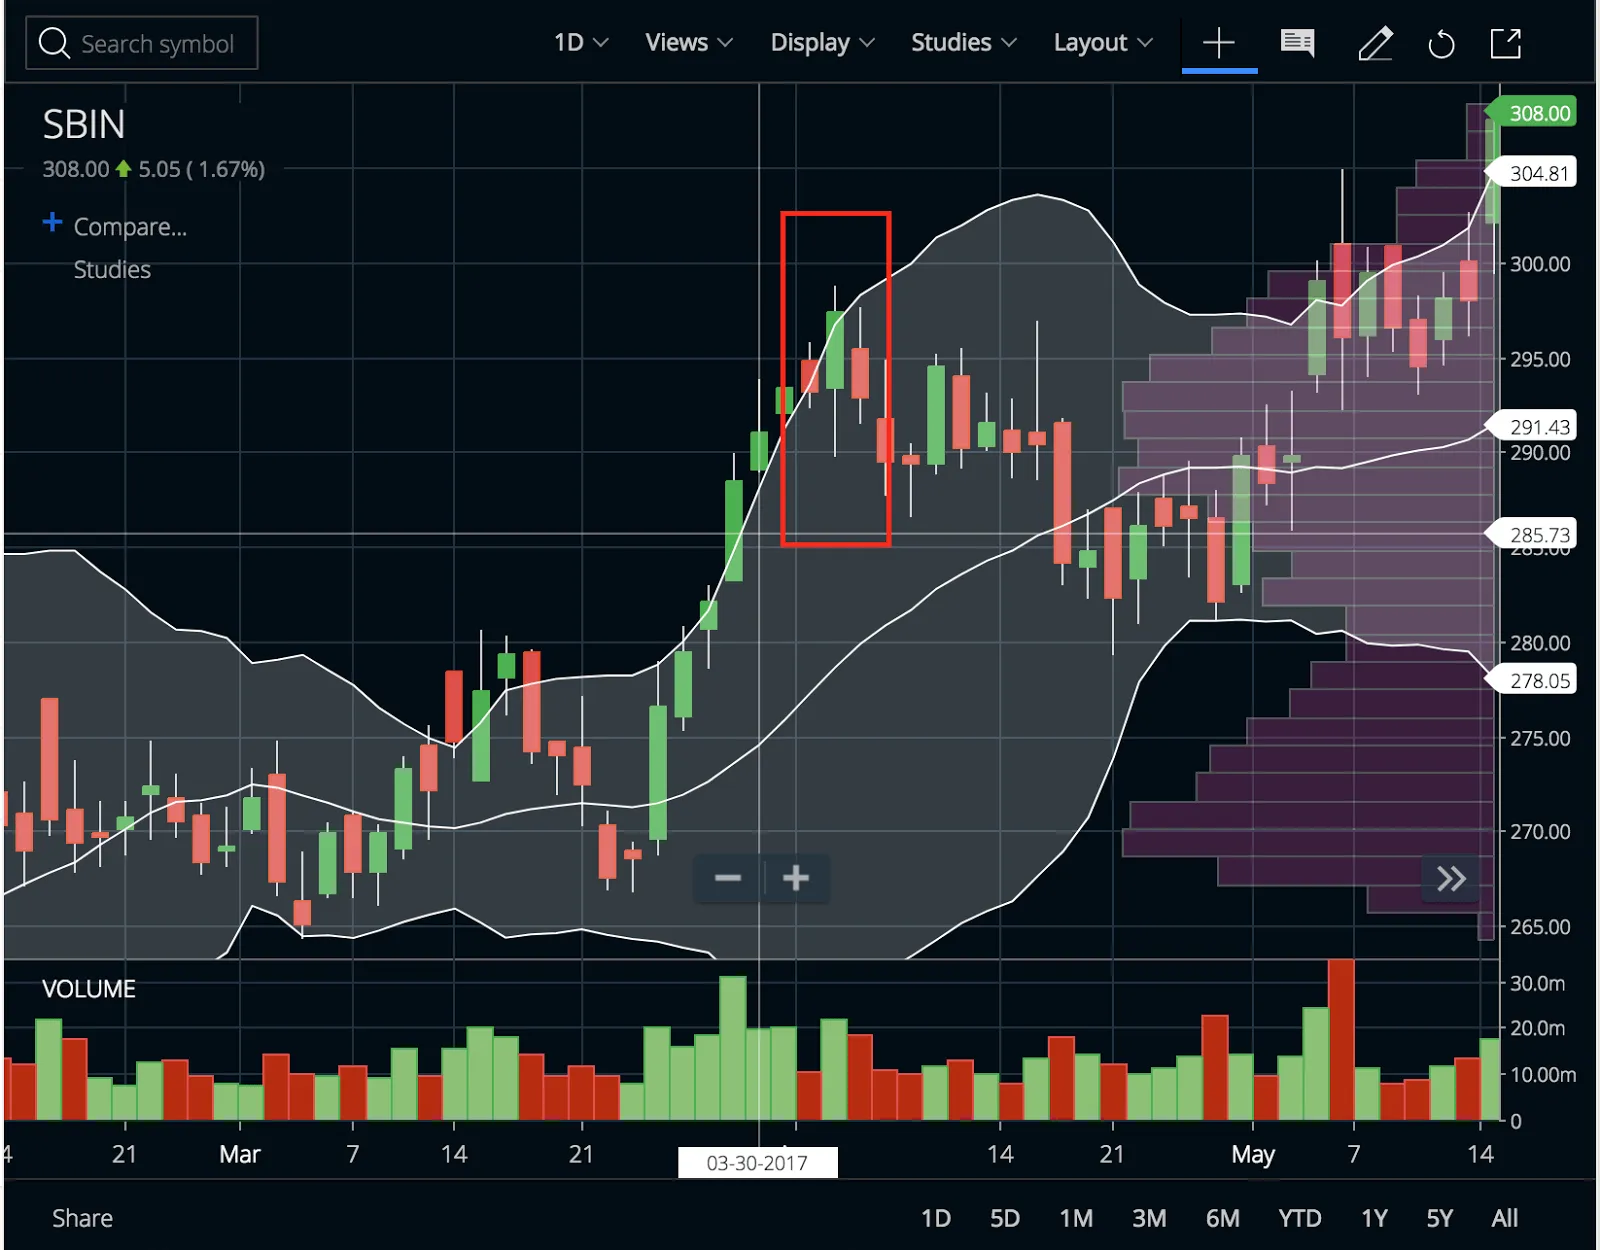
Hammer signifies solid demand has kicked in and a downswing is coming to an end. A shooting star is its opposite. You will find a shooting star after a rally. Post the shooting star, there is a maximum likelihood of price going down! I’ll illustrate the structure of both the candles and then go ahead with their trade setups.
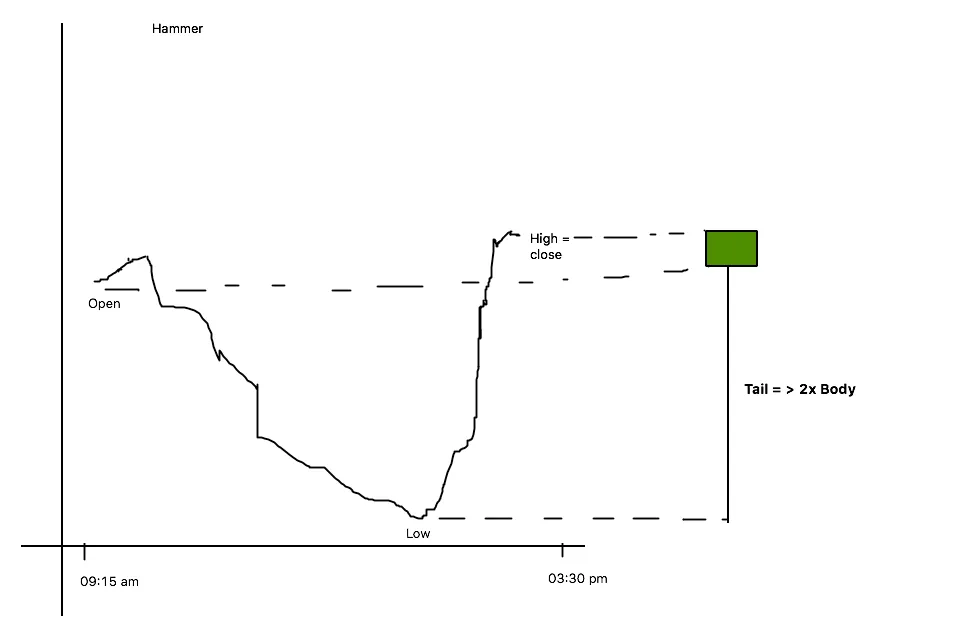
Psychology: The market was crashing right since the opening and suddenly in the afternoon, due to heavy buying, the price closed above the open and at the highest point. This is an indication that whatsoever supply was in the market, it was absorbed and there is fresh buying. The reason maybe whatsoever, we shouldn’t care about it, but the up move is phenomenal. This leads to a candlestick called “Hammer” ( due to its appearance ). The important point is the Tail should be equal to or twice the size of the body.
Location: This candlestick has significance only if it is formed at the Higher bottom or lower bottom. (However, I will discourage anyone to go for lower bottom setup because a lower bottom is found only in a downtrend and we must not trade against the trend if we are beginners).
Colour: Red or Green, it doesn’t matter. A hammer is a hammer and it shows demand kicking in!
Confirmation: The hammer should be traded only on confirmation. If the next day, the price trades above the high of the hammer, go long with a stop loss as low of the hammer. Minimum 1:2 Risk Reward trade should be taken.
Just like the hammer, we will discuss shooting star
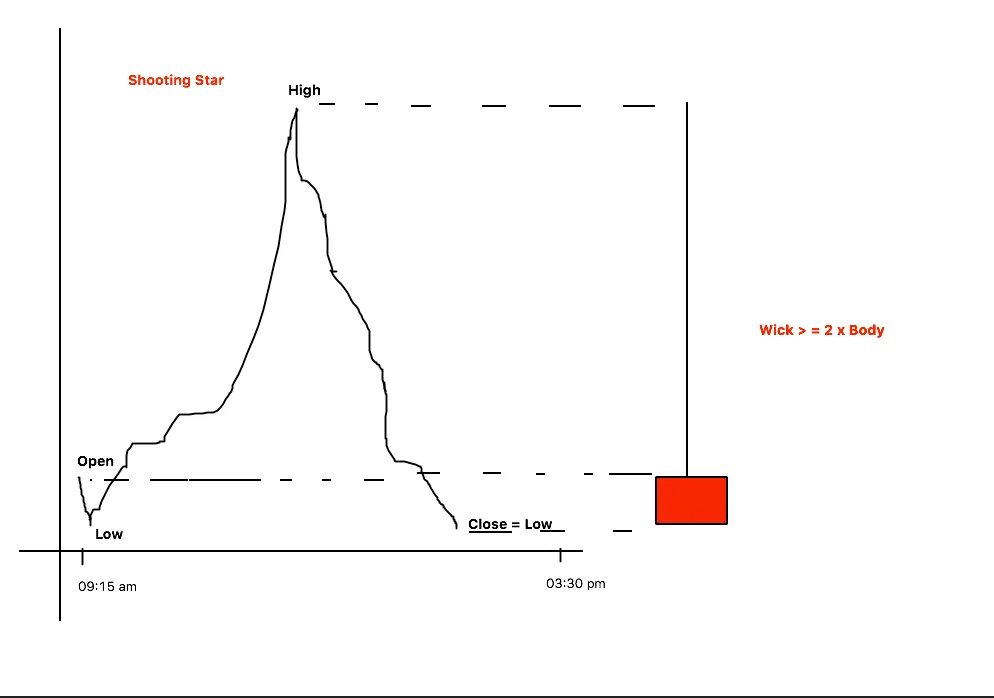
The exact opposite of Hammer. Price went up, the market was happy, and out of nowhere came a bomb! Phenomenal supply was seen and the market crashed. The long wick suggests supply in the market. Like in a hammer, the long tail shows demand.
Psychology: The market was booming right since the opening and suddenly in the afternoon, due to heavy selling, the price closed below the open and at the lowest point. This is an indication that whatsoever demand was in the market, it was absorbed and there is fresh selling. The reason maybe whatsoever, we shouldn’t care about it, but the down move is phenomenal. This leads to a candlestick called “Shooting Star“. The important point is the Wick should be equal to or twice the size of the body.
Location: This candlestick has significance only if it is formed at the Higher Top or lower Top. ( However, I will discourage anyone to go for Higher Top setup because it is found only in an uptrend and we must not trade against the trend if we are beginners).
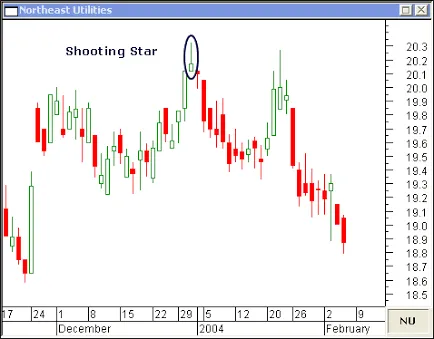
Colour: Red or Green, it doesn’t matter. A Shootings star is a shooting star and it shows supply kicking in!
Confirmation: The Shooting should be traded only on confirmation. If the next day, the price trades below the low of the shooting star, go short with a stop loss as high of the shooting star. Minimum 1:2 Risk Reward trade should be taken.
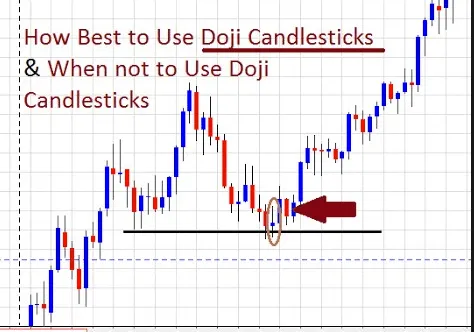
The next setup is Doji
Psychology: As mentioned above, Doji means confusion. No direction and no confirmation in the market. It is a literal tug-of-war between bulls and bears. Doji’s major significance is that it is a speed breaker. Just imagine, the market is going berserk for 3-4 days with continuous 2-3% move upside and suddenly on the 5th day, you spot a Doji, what does it mean? Don’t you think that the bulls are tired now that they have to fight for their dominance? Don’t you think the bears are becoming stronger and they are giving the bulls a fight for their money? This is exactly what happens and hence Doji is also a speed breaker.
Location: Find it important only at Higher top/bottom and Lower top/bottom ( just make sure you don’t trade against the trend).
Trade setup: Buy when price trades above the high of the Doji, keep SL as low of the Doji. Short when price trades below the low of the Doji, keep SL as the high of the Doji.
Important note: If the Doji has a small body (either red or green) it is called a spinning top. Nothing is in a name, treat and trade it just like a Doji but the body has to be small.
The trading setup for hammer, shooting star and Doji is the same! Buy above high keep low as SL/Short below low keeps high as SL. I hope everyone understood.
Q. If Doji slows down the pace if the trend is weak, won’t it also signal reversal?
A. Trend can’t be weak. It is either up or down. we are using Dojis to find the end of swings and not trends. The trend will be changed from down to up when the higher top and higher bottom formation starts.
Q. How to deal with Doji, are there any clues that we have beforehand to predict this on a daily time frame? or we just have to wait until the end of the day to get to know that it was the Doji day and then predict future actions?
A. There is no way to predict anything in stock markets. We have to wait until the end of the day, take proper confirmation and then only make a trading decision. If we don’t follow this then we are just speculating.
Q. What is the best time frame for an intraday trader, to trade Doji or shooting star?
A. 15 mins as per my personal experience.
Q. Does volume have any correlation with a hammer or shooting star?
A. Volume is important in its own place. However, as per my backtesting, we can ignore it and keep it simple on the basis of price.
Q. I think Kapil clearly mentioned price action does not consider volume?
A. It does consider volume but I don’t consider volume when trading with trend and candlesticks. There are few volume concepts later.
Dojis are prone to false signals. You will find Dojis after Dojis. Personally, it is not my favorite setup to trade on. But this trade setup is explained as it forms a part of slightly advanced trade setups and Doji’s are giving false signals because they are not at the higher bottom area, Higher bottom Dojis won’t give many false signals.
The method to ascertain a bottom or top is an advanced concept. it will be covered later.
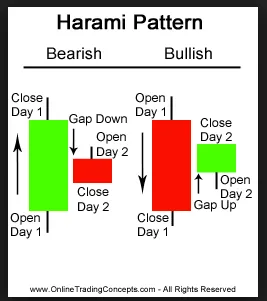
In Japanese, Harami means pregnant.
Structure: A Harami candle is a 2 candlestick pattern. The first candle is a mother candle and the second candle is a baby candle. This might give u an idea that the second candle must be inside the body of the first candle. A bullish harami appears at the end of a downswing and bearish harami at the end of an upswing.
Psychology: After consecutive down moves, one fine day the market gap opens up and holds the position. it doesn’t fall down. This signifies that bulls are back. They are giving a tough fight to the bears. This setup is confirmation enough. for bearish harami, the psychology will be similar.
Location: Bullish Harami has to be spotted only at a higher bottom or Lower bottom but never go for lower bottom setup because it is against the trend. Bearish Harami has to be spotted only at a Higher Top or Lower top but avoids higher top setup because it is against the trend.
Trade setup: Wait till EOD for both the candle to be formed. On the 3rd day go long in bullish harami setup and keep stop loss as low of mother candle. For bearish harami, on the 3rd day go short and keep stop loss as high of the mother candle.
In a Bullish Harami, MOTHER candle is ALWAYS RED and the BABY candle is ALWAYS GREEN. In a Bearish Harami, MOTHER candle is ALWAYS GREEN and BABY candle is ALWAYS RED.
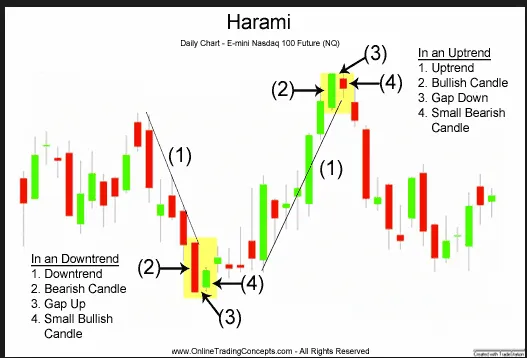
Follow this setup as an example. Kindly consider downtrend as downswing and uptrend as upswing.
Q. Also, is it necessary for bearish harami to be completely enclosed in the green mother? What if the child closes even lower. like in the following case?
A. Then it is not a good quality candlestick setup. Strictly avoid.
This price action setup follows closing based stop loss. Not our stubborn stop loss. Generally, it is due to avoid us from supreme volatility in day trading (mostly due to synthetic effects). The last signal generated from our system was ‘Buy Asian Paints on 1135 – 1145 zone with a target towards 1180 having CBSL at 1120.
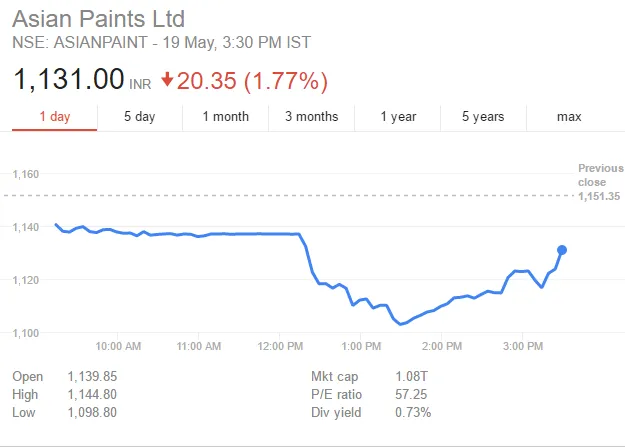
It went certainly below 1120 during daytime but it closed above 1120. If we had closed it near 1100 zone realizing loss it would have a huge bad scenario. It’s closing based stop loss. Hence, trade is on.
Related Posts