Analyzing multiple time frames in trading
Update: This article is deprecated. You have dug out an old article that is poor and outdated in terms of content. Please click here to read the current article on this topic.
It’s deceptive.
Case 1 – 30 Minute Timeframe:
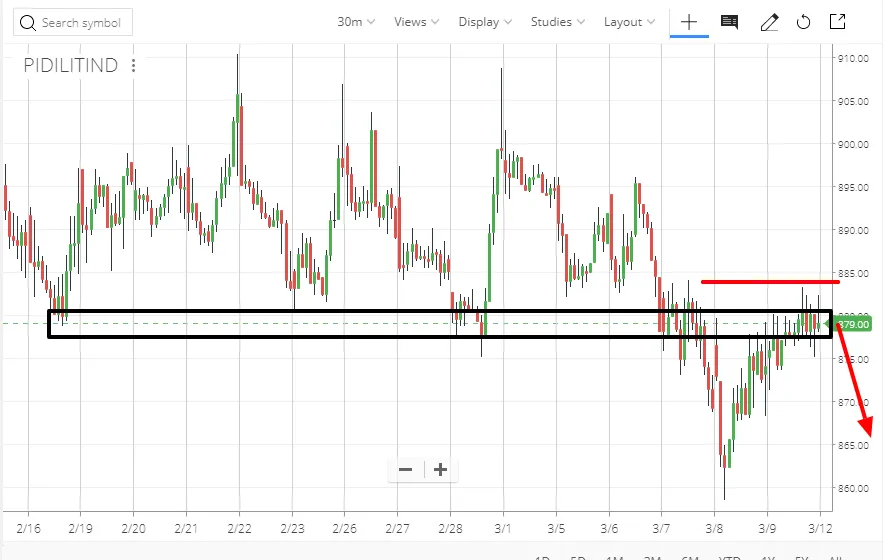
Pidilite has recently broken its support (marked with black) and once support is broken the support becomes the new resistance.
Short Pidilite with the red line as a stop loss!
Case 2 – 1 Day Timeframe:
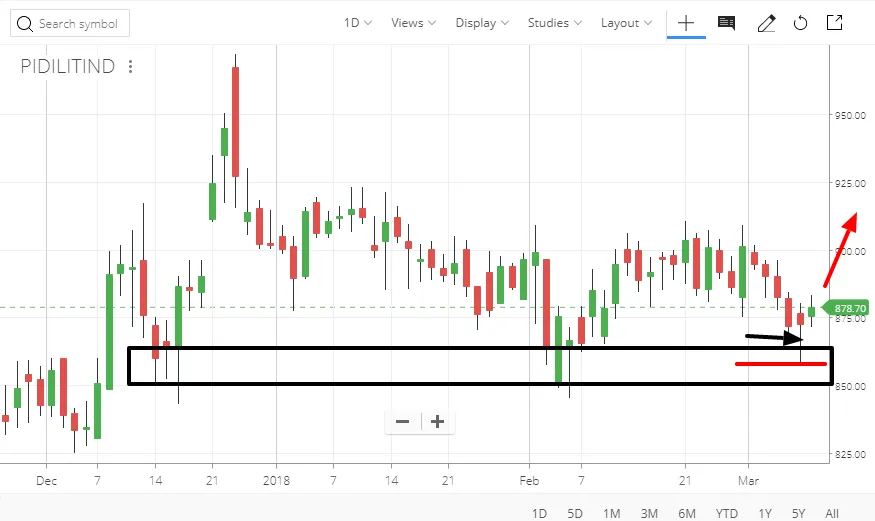
Pidilite is consolidating for a long time and it is in the potential reverse zone and already you can see a sign of strong reversal with a pin bar followed by a green candle after that day.
Long Pidilite with the red line as stop loss.
Smart Money will go with Case 2 where retailers will go with Case 1. Wait, Smart Money already went for Case 2!
What Should You do – Trade only when Case 1 and Case 2 both tell you to buy or sell at the same time. It will increase your survival.
Related Posts