Introduction :
Incorporated in 1985, Capital Trust Limited is a Non-Banking Finance Company with over 30 years in the financial services industry. Promoted by some of the most prominent bankers of its time, including Mr. K R. Puri (former Governor, RBI), Mr. R.K. Kaul (former Deputy Governor, RBI) and Justice H. S. Beg (former Chief Justice of India), Capital Trust Limited has a history of having represented over 25 international banks, having had Joint Ventures with Kinetic for two-wheeler financing and Joint Ventures with DBS Bank of Singapore for Stock Broking.
In September 2016, Capital Trust acquired an NBFC-MFI which is now operating as a 100% owned subsidiary of the company In 2008, Capital Trust Limited stopped its prior consultancy services and ventured into the foray of Microfinance. With the change in RBI regulations regarding NBFCs in 2012, Capital Trust started focusing on providing capital to the unbanked individuals in the MSME sector. However, by becoming Yes Bank Limited’s Business Correspondent in 2014, Capital Trust Limited became one of the few companies in the country that could span both, the Microfinance and the MSME Industry.
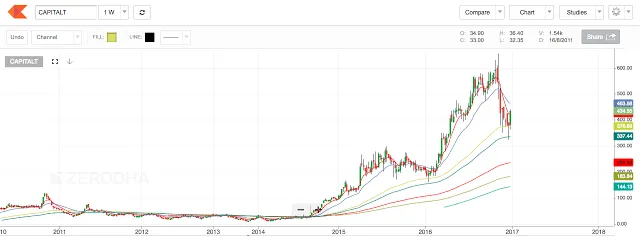
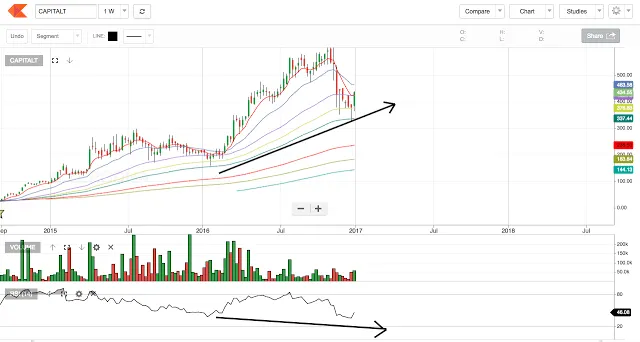
1. Its long-term trend is up as price is making a higher top higher bottom formation and mid and long-term EMA’s are moving upwards.
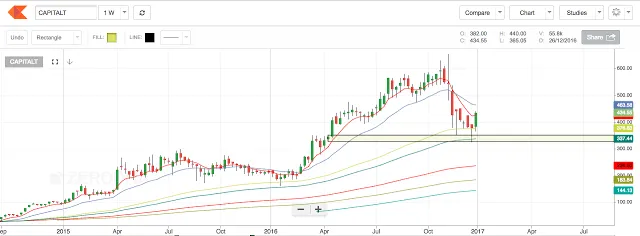
2. On the weekly charts, the price has hit the demand zone of 330-345 and formed a strong Hammer candlestick. The Hammer candle has been confirmed with the long-range green candle with relatively higher volume. This depicts the psychology of bulls who pulled up the price from the recent low of 325 and are holding it strongly at the CMP of 434.55.
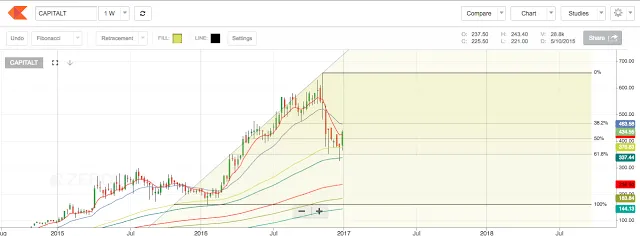
3. If we consider the previous swing of 160 – 655, we can see that the bullish action has been witnessed at the 61.8% retracement level. This is a hotspot for Smart Money to add their positions.
By following the basic trend theory, a higher high should be formed and for that, the minimum target of 655 has to be achieved. That is a whopping 50% from the CMP. The Fibonacci extension projects price at 849 (95%) and 964 (121%).
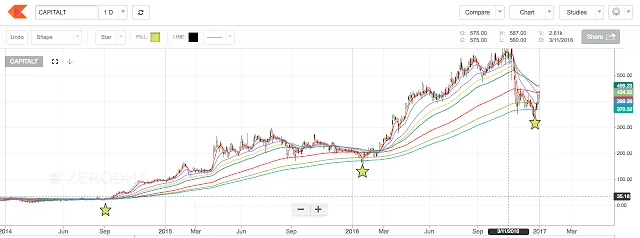
4. Historically speaking, the price has a tendency of bouncing back from the 365 days EMA.
These long-term EMAs are favorite spots for institutional buyers like Mutual funds to add their positions. Every script has a certain behavior and it displays reversion to mean ( averages ). It means that periodically, that EMA will pull price towards itself like a magnet and from there, a fresh rally will begin. Over here, the 365 days EMA is the spot where fresh buying has been witnessed.
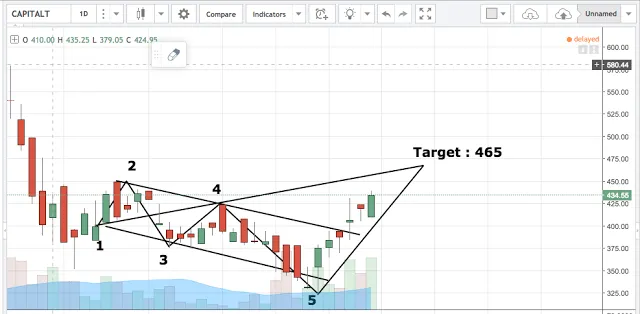
5. For the short term trader, there can be an upside of 7% from the cmp of 434.55 to achieve a target of 635. The ideal entry from this trade should have been around 340, however, one can make a decent profit in a short period of time of few days.
6. The final nail in the coffin is the Hidden Bullish Divergence displayed by the script. The price is making a higher bottom and RSI(14) is making is the lower bottom. This shows that the price is going to continue its up move. This calls for a very strong upside in the days to come.
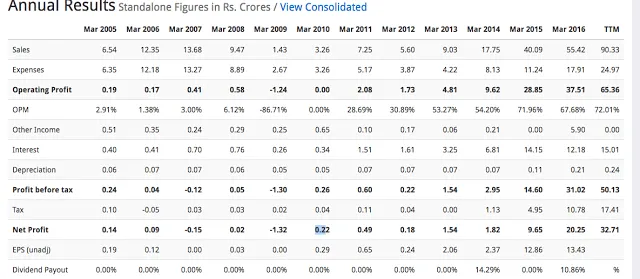
From the fundamental point of view, one can refer to the phenomenal increase in operating profit and PBT, PAT!
This makes Capital Trust a solid Techno-Funda script for handsome gains!
P.S. – This price analysis is invalid once the price falls below 250.
Related Posts