1. Its long-term trend is up as price is making a higher top higher bottom formation and mid and long-term EMA’s are moving upwards.
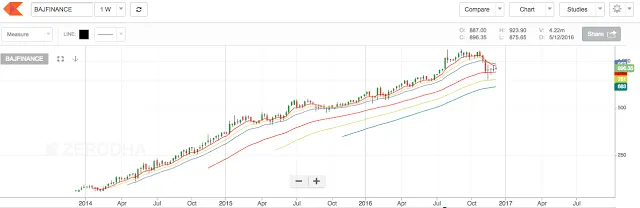
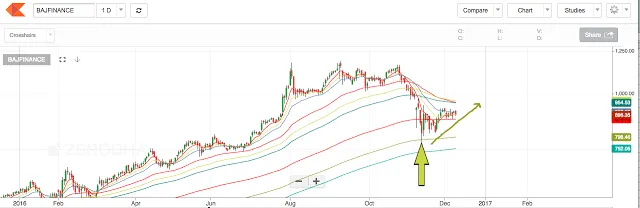
2. Recently the price has gone through a major correction and the script was available at the 300 EMA of around 790. For a long-term investor, such dips are like goldmines as they get an opportunity to buy a high growth stock at a heavy discount. From that level, the price has slowly moved up and has touched a recent high of 929.9. This is an indication of accumulation at lower levels.
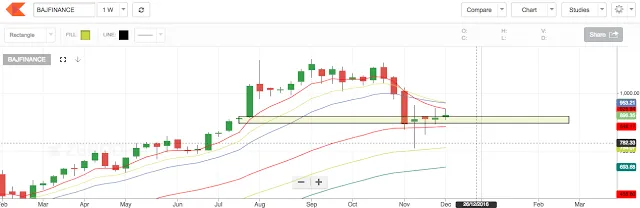
3. Recently, we have seen a lot of volatility in the price given the presence of international and national events of extreme importance. This has resulted in the price moving around the weekly demand zone. This is a high probability area for an upside move as institutional buyers are very likely to accumulate the script at these levels. The weekly demand zone of 888 – 858 has been held strongly for 4 weeks. At the current price of 896, a short-term investor can make a safe entry with an aim of new all-time high ( 1187).
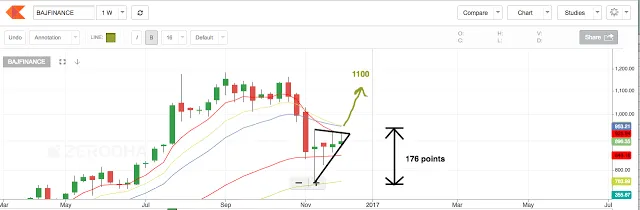
4. On the weekly chart, an ascending triangle has been observed with a height of 176 points. A breakout will fetch a target for 1100. A safe entry for short-term traders in cash and F&O will be above 929 ( spot ).
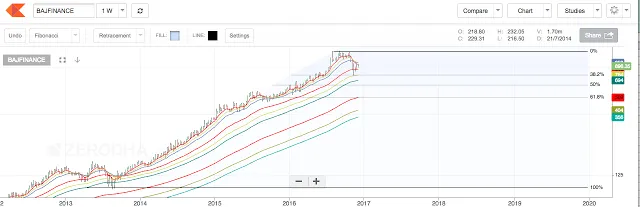
5. If we consider the previous swing from 98 to 1182 and use the Fibonacci retracement tool, we can observe that the correction has occurred at the 38.2% level which is a decently healthy correction for such a long-running rally. The Fibonacci extension tool shows that a future high around 1650 – 1900 is possible. This gives our long-term investors an upside scope of 84% to 112 %!
Related Posts