Timeframe
The timeframe of a chart can be from 1 Min to 1 Hr in day trading and 1 Day to 1 Year is positional trading. Larger time frames give more reliable price signals that means a trend formation in a daily or weekly chart is more reliable and perfect than 1 Hr or 30 Min time frame charts. Smaller time frames can give the false signal and false breakout sometimes which lead to wrong trade entry.
Trend
Market direction is generally known as Trend. The perfect trend is seen in Daily chart if it is heading towards upside then an upward trend, if it is heading towards downside then downtrend otherwise sideways trend.
All type of trend is shown below.
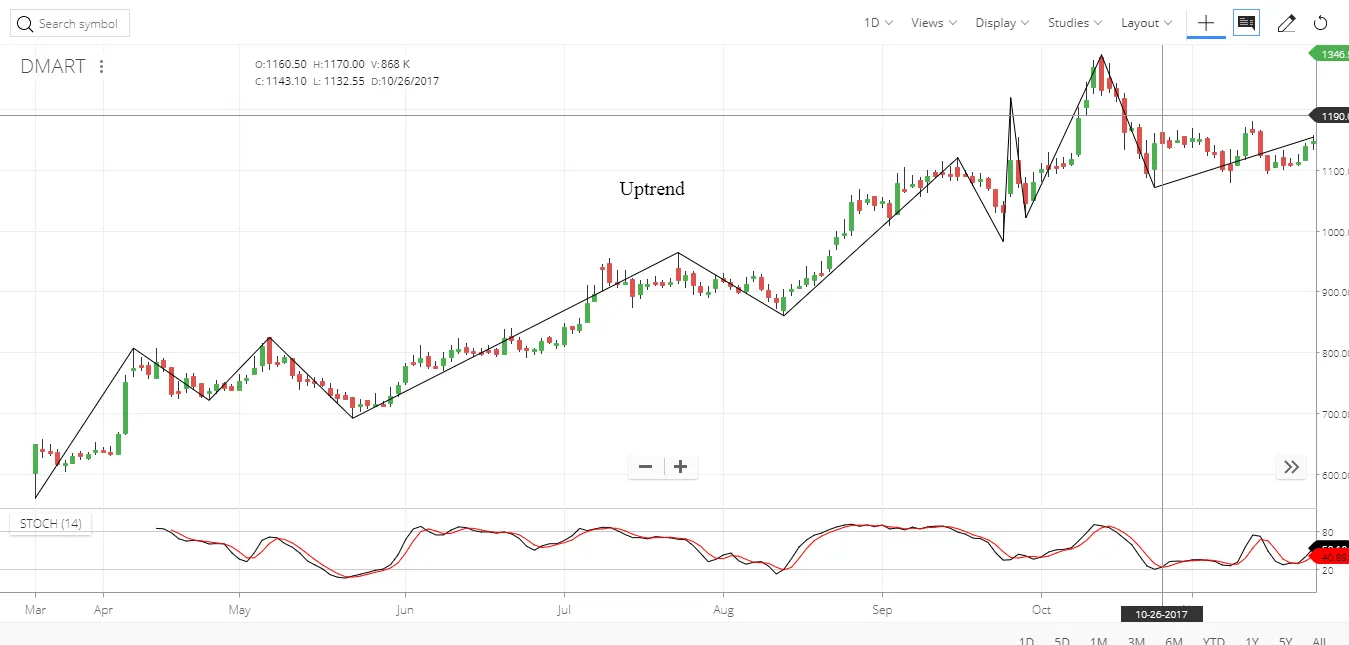
In the above image, an uptrend is shown that creates continuous higher highs and higher lows that creates an upward trend.
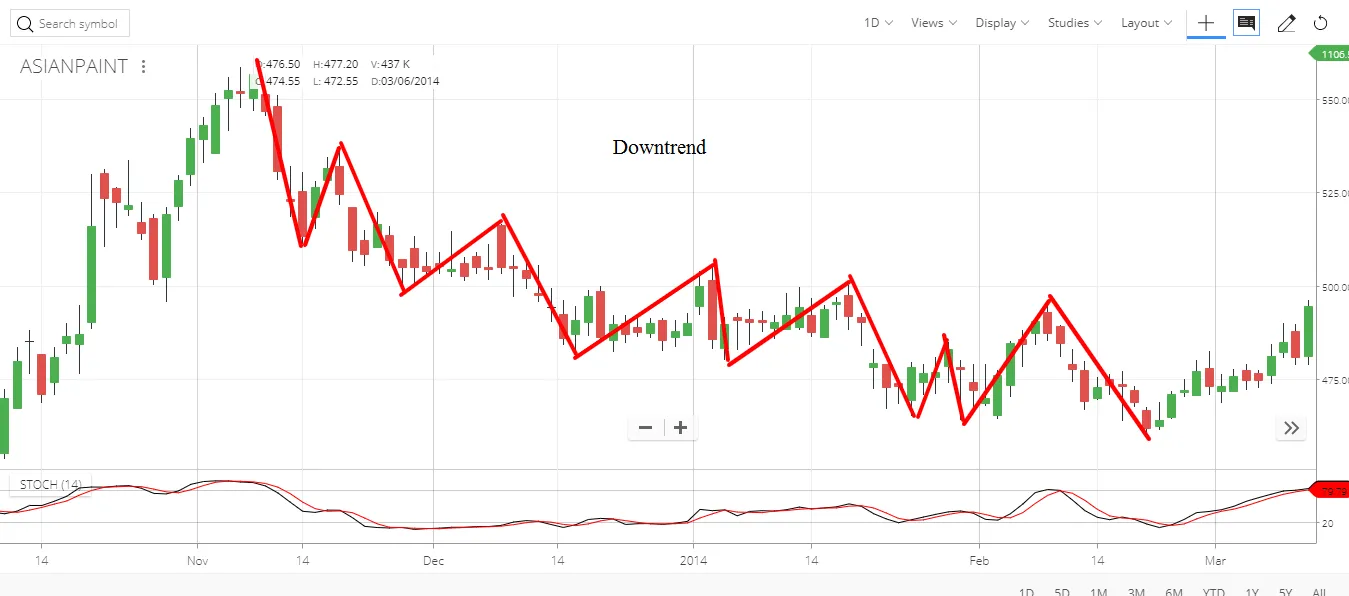
In the above image, a downtrend is shown that creates continuous lower highs and lower lows that creates a downward trend.
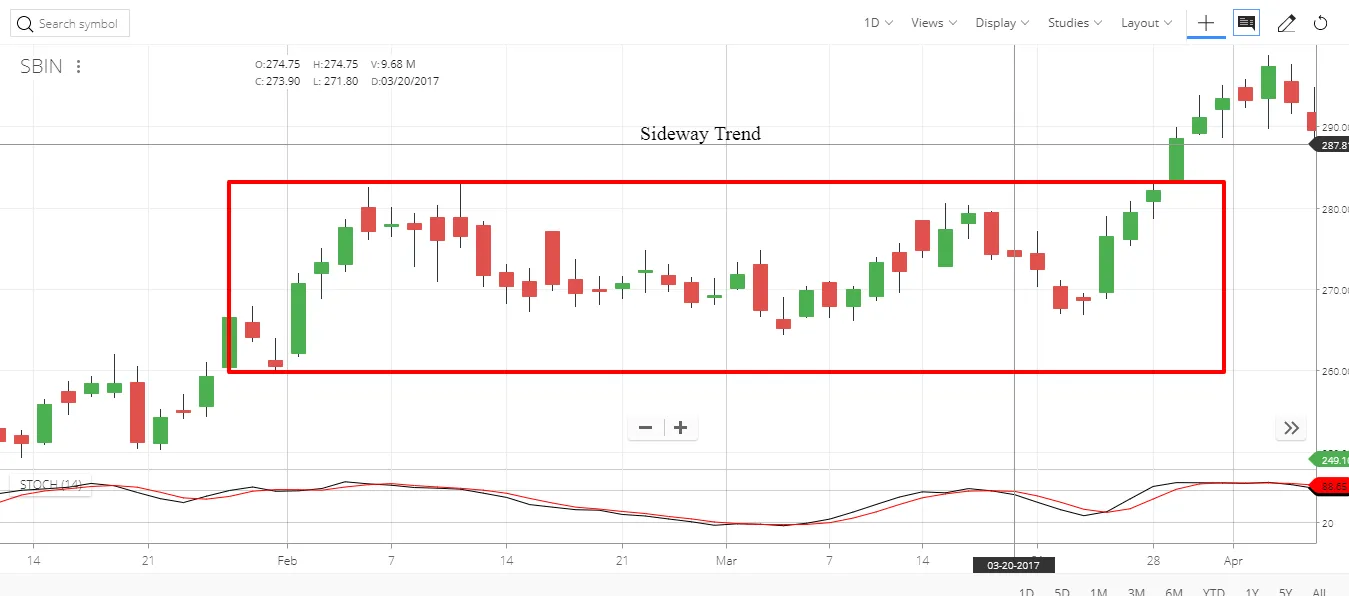
n the above image sideways trend is shown. The price is consolidating in the given range which creates a sideways trend. In a sideways trend, the breakout can occur on both sides i.e. upward or downtrend.
It is said that Trend is the friend of the trader; it is always recommended to trade in the direction of the trend.
Moving Averages
Moving average is most used price indicator in the stock market. It is known as lagging indicator because it depends upon past prices. Simple Moving Average (SMA) and Exponential Moving Average (EMA) are the two most used Moving Averages in the market. There are other types of moving average also like Double Exponential Moving Average (DEMA) but they are not widely used. Let’s calculate Moving average of Tata Consultancy Services. SMA (10) is an average counted taking last 10 prices. Let’s calculate SMA (10) on 17/11/2017.
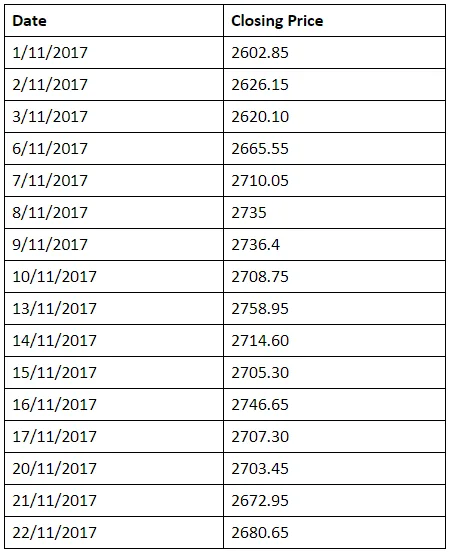
Calculating SMA (10) on 17/11/2017 we have to take 10 closing prices starting from 6/11/2017.
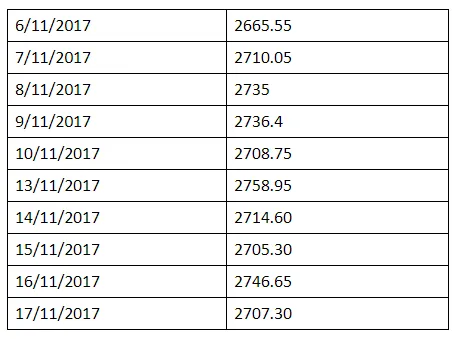
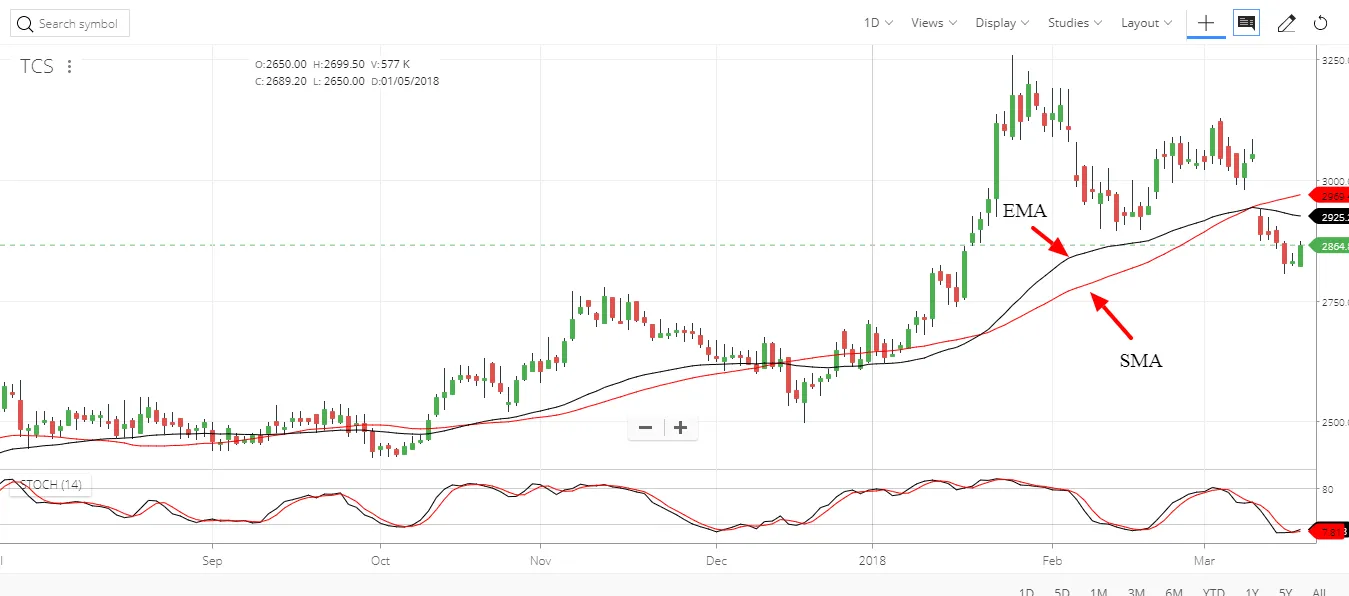
So the average of (2665.55, 2710.05, 2735, 2736.4, 2708.75, 2758, 2714.60, 2705.30, 2746.65, 2707.30) is 2718.855. Exponential Moving Average (EMA) gives more weight to more recent prices so it reflects the recent price than past ones. It is more reactive to prices. The following image shows 50 SMA and EMA of TCS. Both SMA and EMA are shown with the arrow.
Mean Reversion
Price moves around a central point that is called the MEAN or moving average. Price of a stock always move towards the mean or away from the mean. So trader trade in the direction of the slope of the mean.
Mean reversion is the heart of all market movements. Prices are going away from the mean or coming towards the mean. Prices are always moving back to the central point from an extreme point and always move towards extreme point from the central point. This is the basis of mean reversion.
Simple trades using 50 EMA
We can use 50 EMA to trade in the direction of the trend as follow.
Buy when the current market price of a security closes above the 50 days EMA and Sell or Short when the Current market price of a security closes below the 50 days EMA.
That’s it.
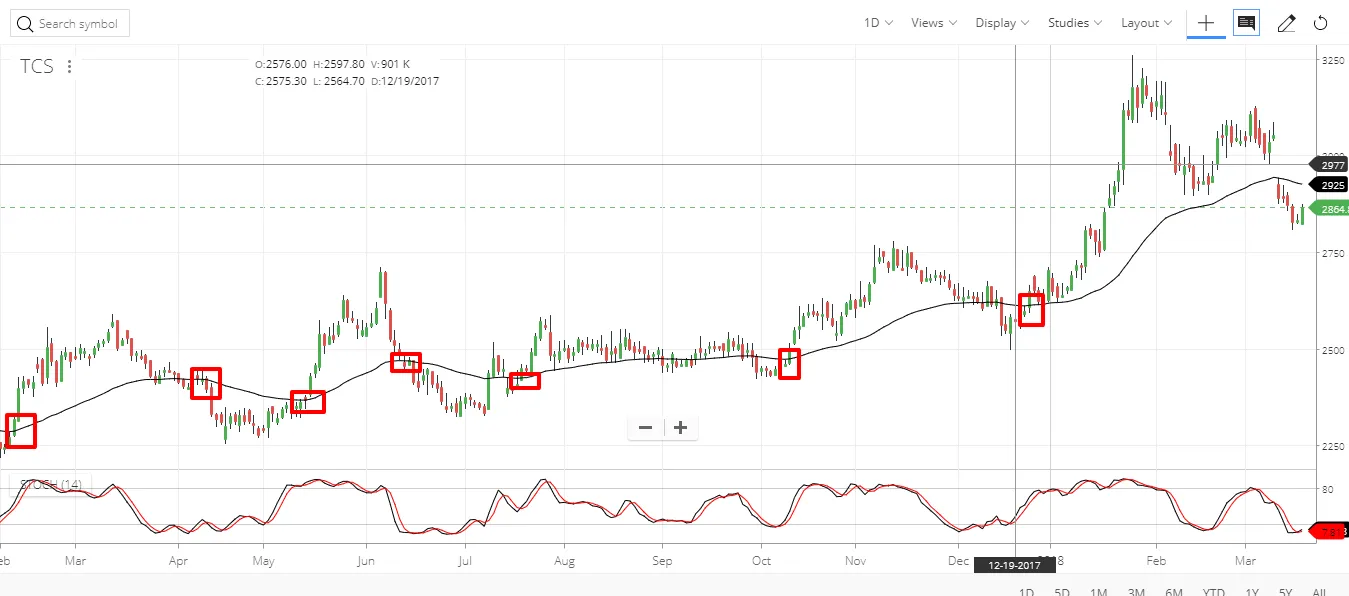
As shown in above chart of TCS square boxes indicates the closing of price above or below the 50 Day EMA. So we can trade at that point with strict stop loss.
Trade using Moving Average Crossover
As explained in the above example, trading using single EMA system generates too many false signals. To overcome this we can use a moving average crossover system.
Let’s take an example of 50 EMA and 100 EMA crossover of TORNTPHARM.
A 50 day EMA is shorter or faster-moving average and 100 days EMA is longer or slower moving average.
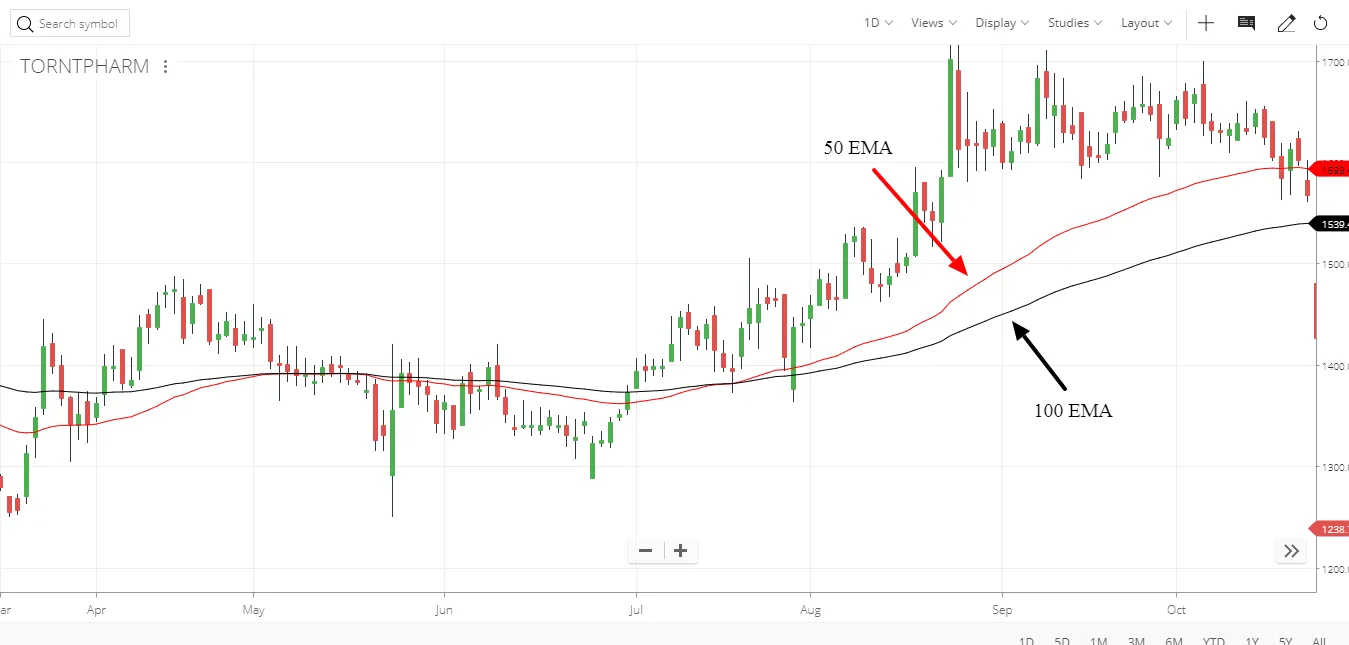
As shown in the figure red line is 50 days EMA and the black line is 100 day EMA. 50 day EMA is closer to current market prices and 100 days EMA is away from current market prices as it reacts slower. A trader can trade using crossover as following.
Initiate a new buy when short-term moving average turns greater than the long-term moving average.
Short it when the short term moving average turns lesser than the long-term moving average.
A trader can take the combination of various EMA as per their holding period and risk appetite.
Some of the famous combinations of moving average crossovers are
- 9 day EMA with 21 days EMA
- 50 day EMA with 100 days EMA
- 100 day EMA with 200 days EMA
Let’s take an example of 9 days EMA and 21 days EMA in an hourly chart of SUN PHARMA.
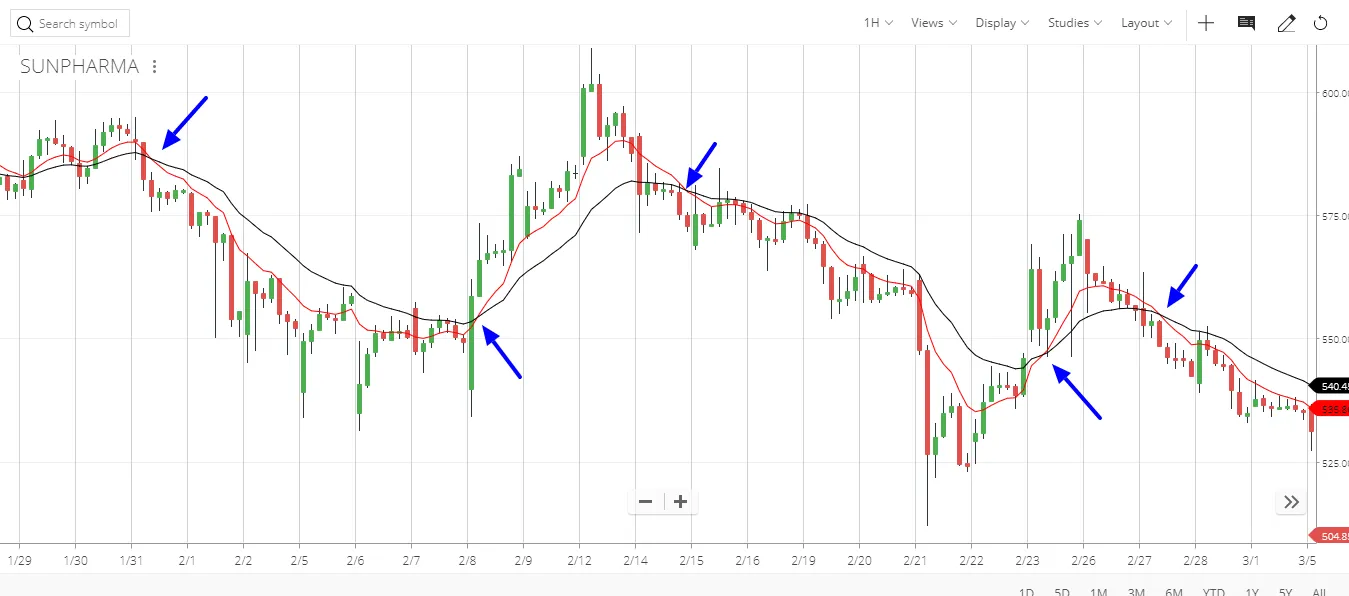
Moving Average Crossover shown with the blue arrow that can be traded.
For shorter time frames, the short period combination can be taken and for higher time frames high period combination can be taken.
For shorter time frames 15 Min EMA and 30 Min EMA can also be taken in day trading.
Price Action within the trend
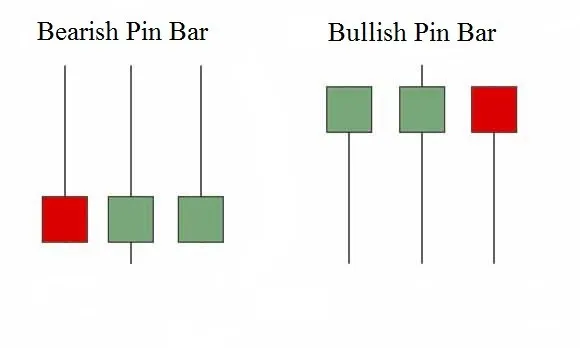
Pin Bar
Pin bar is a 1 bar formation. The pin bar is a price bar which has rejected higher or lowers prices. Price will open and move in one direction, and then “reverse” during the session to close at or past the open.
The candle is easy to spot because it has a “tail” or deep wick. Not all candles with tails are pin bars. Only a bar with a tail, often much larger than its body can be called a pin bar. Usually, the market closes past the open, or at the open. It is a common reversal signal which typically needs to occur near a support or resistance area (horizontal level or dynamic moving average).
Some traders use them in conjunction with Fibonacci retracements as well as trends or simple pivot/swing Fibonacci retracements as well as trends or simple pivot/swing levels.
In a nutshell, Pin bars are the ultimate strategy for picking up major swings in prices.
Let’s check an example of pin bars in HDFC.
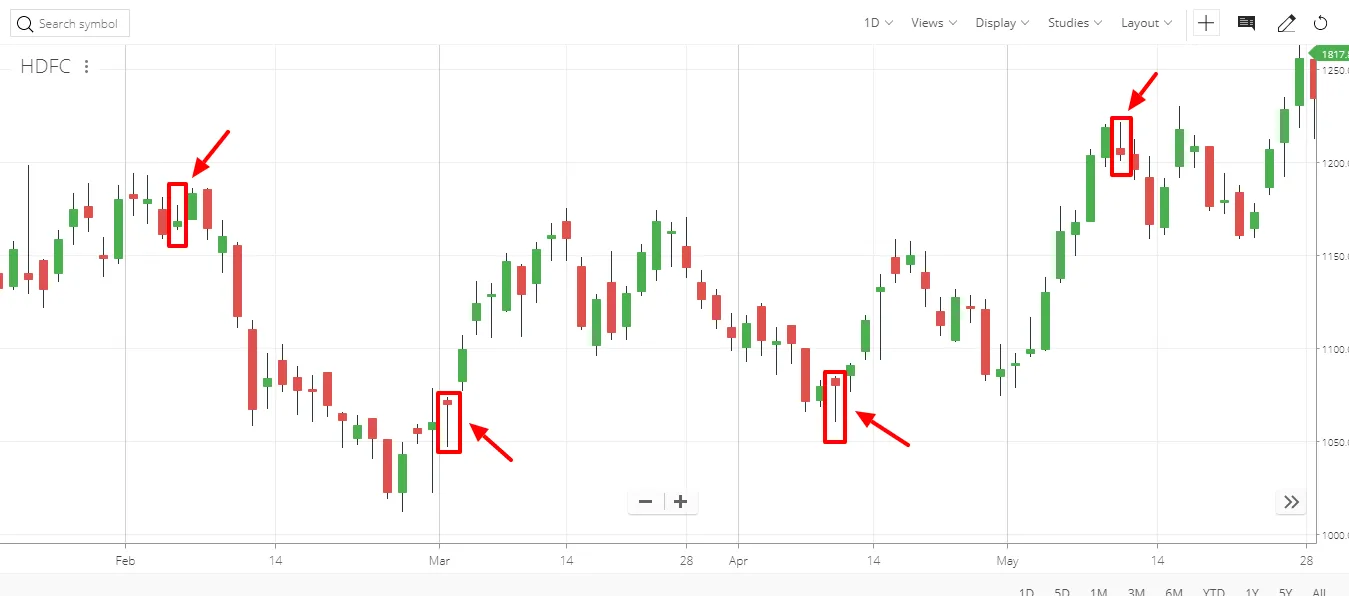
Pin bars shown with the red arrows at the support or resistance level shows the reversal of price and it acts as a price action point.
There are 2 ways to enter directly from the pin bar.
Aggressive
Sometimes, right after the nose bar closes, the next bar will open and immediately take off in your favor, but sometimes without you! This aggressive method makes sure that doesn’t happen, but not without a little bit more risk. To ensure that the trade doesn’t leave without you, you may use market entry. This way you are filled and happily making points when the bar decides to drop like a rock without retracing at all. Place your stop just above the top of the tail. For an even more aggressive trade, place your stop above or below 60% of the range of the bar.
Conservative
Many times, on the daily chart, particularly if the pin bar is large in range, I see a market retrace a little before reversing and plummeting or rallying, it might be 1 day or even 1 to 2 weeks, but often, there is a retracement before the signal comes off in the desired direction. The more conservative way to enter the pin bar setup, basically wait for the price to retrace to some extent. The drawback of the conservative method is that you will sometimes miss out on that trade.
Let’s understand with the example of HDFC chart.
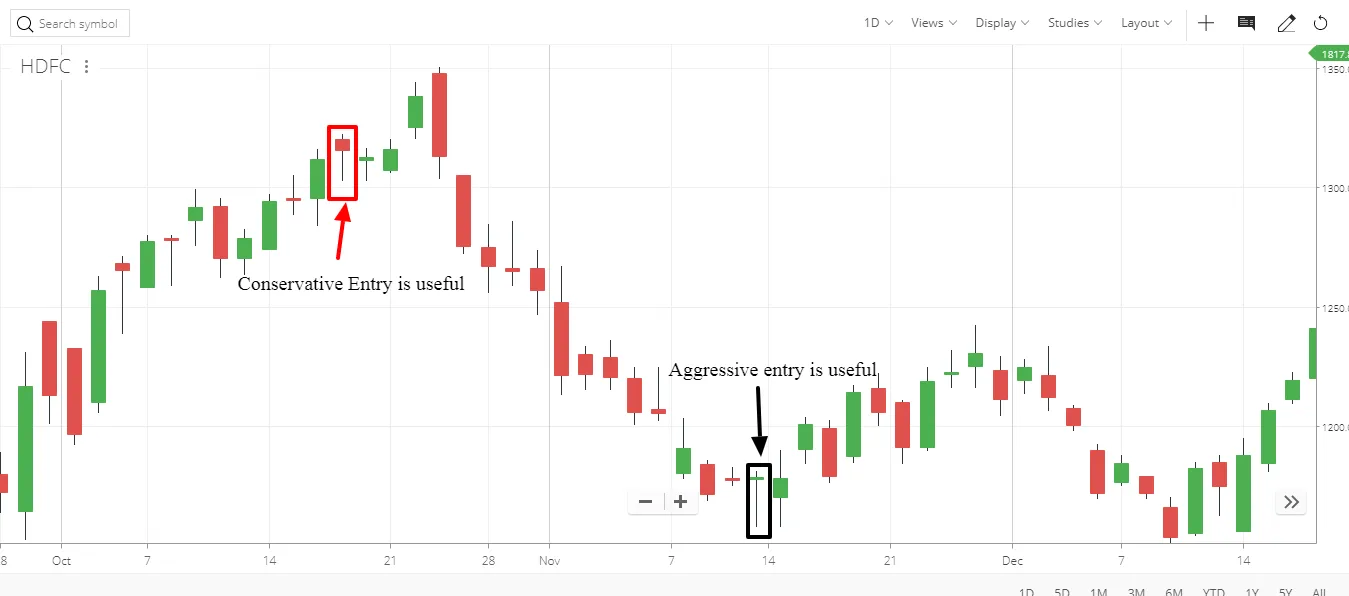
As shown in above figure first pin bar marked with red arrow created and after that stock retraced to some extent. In this case conservative entry can be useful as it saves few points because of getting a better entry.
But in the case of pin bar shown with black arrow aggressive entry can be used as the move triggered immediately after the pin bar formation.
Trade with Pin Bar in the direction of the trend
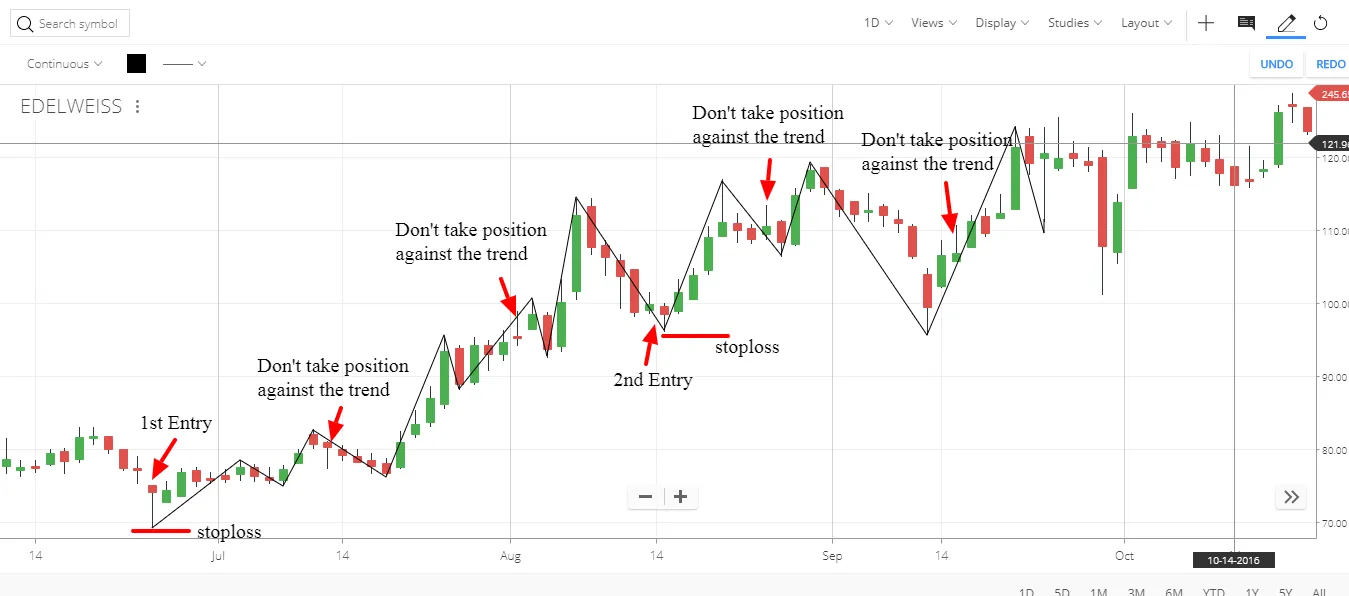
As shown in above image pin bar is shown with the red arrows.
The direction of the trend is upside so 1st entry in the direction should be taken with stop loss but after that for bearish pin bar, fresh entry can be avoided because it is against the trend.
At the 2nd entry, Bullish pin bar is created so trade can be taken with a stop loss at the red line.
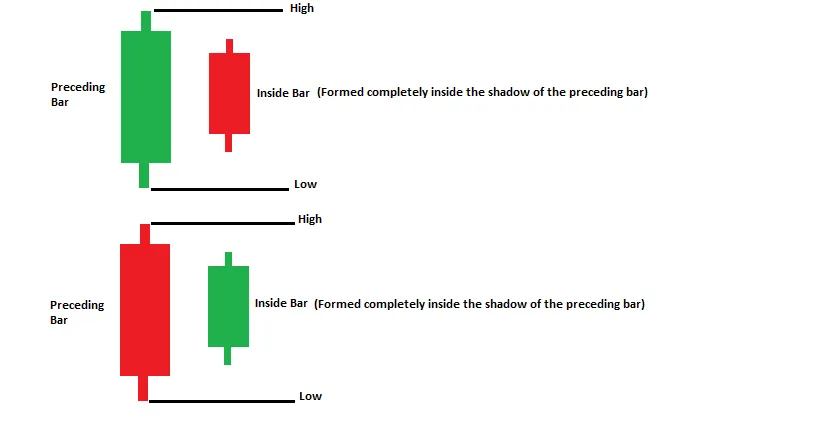
Inside Bar
Inside the bar is a bar or series of bars which is/are completely within the range of the preceding bar.
An inside bar indicates a time of indecision or consolidation. Inside bars often occurs at tops and bottoms, in continuation flag, and at key decision points like major support/resistance level and breakouts. They provide a low-risk place to enter a trade or a logical exit point.
Inside bars often stall market movements, so they are good reversal patterns both with the trend and against the trend.
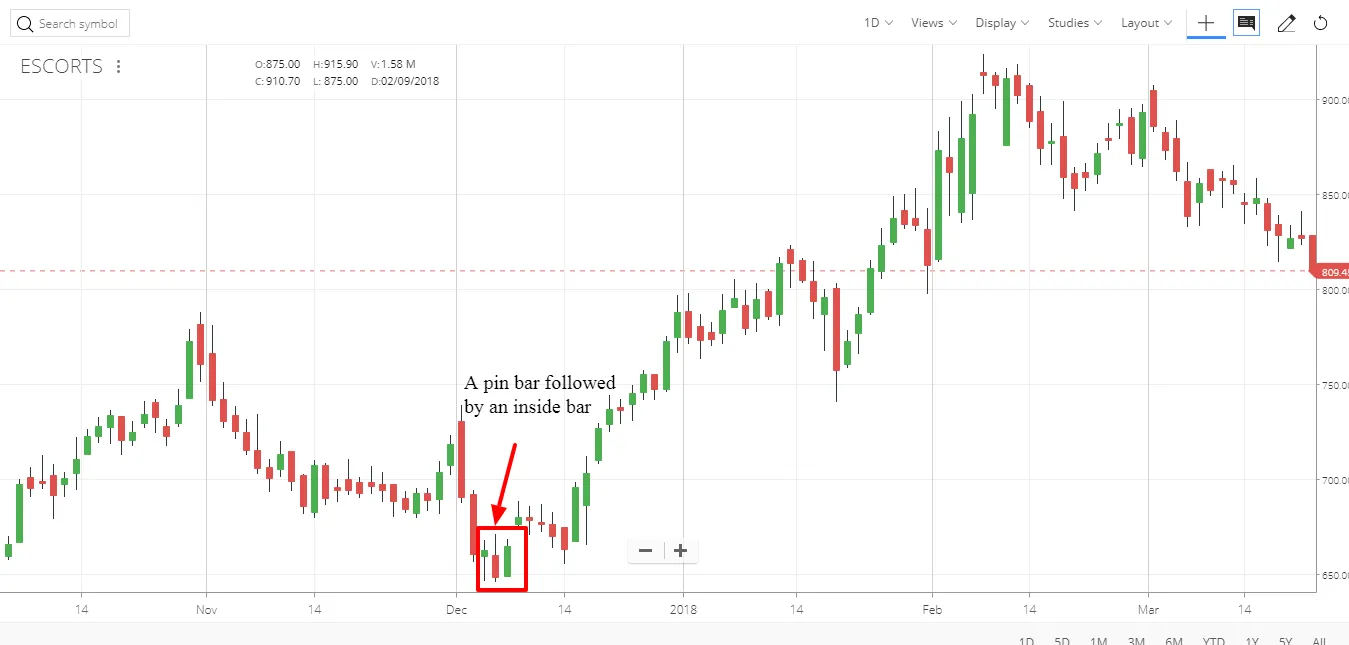
As shown in above image of ESCORT inside bar followed by a pin bar led a strong up move.
Trade with inside bar and other price action indicators
Let’s take an example of Apollo Hospital.
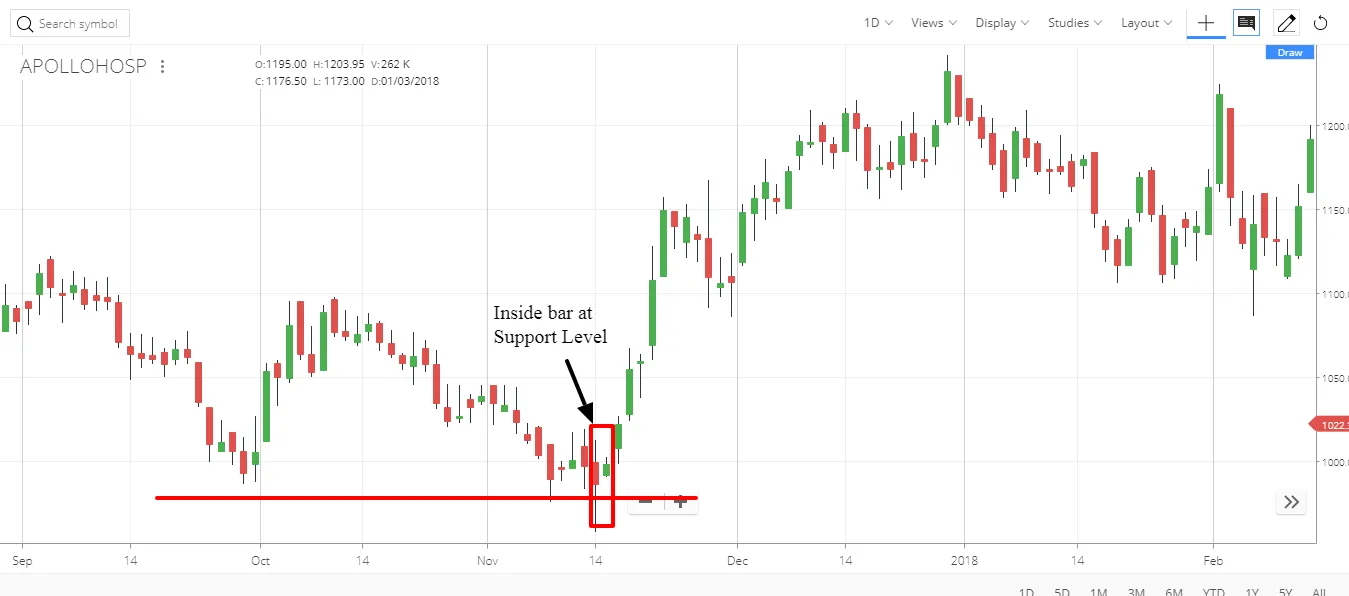
As shown in the above image an inside bar created at the support level which indicates trend reversal and it is followed by a massive uptrend with a decent move.
Example of HDFC shown below is an example of inside bar creation within the trend itself.
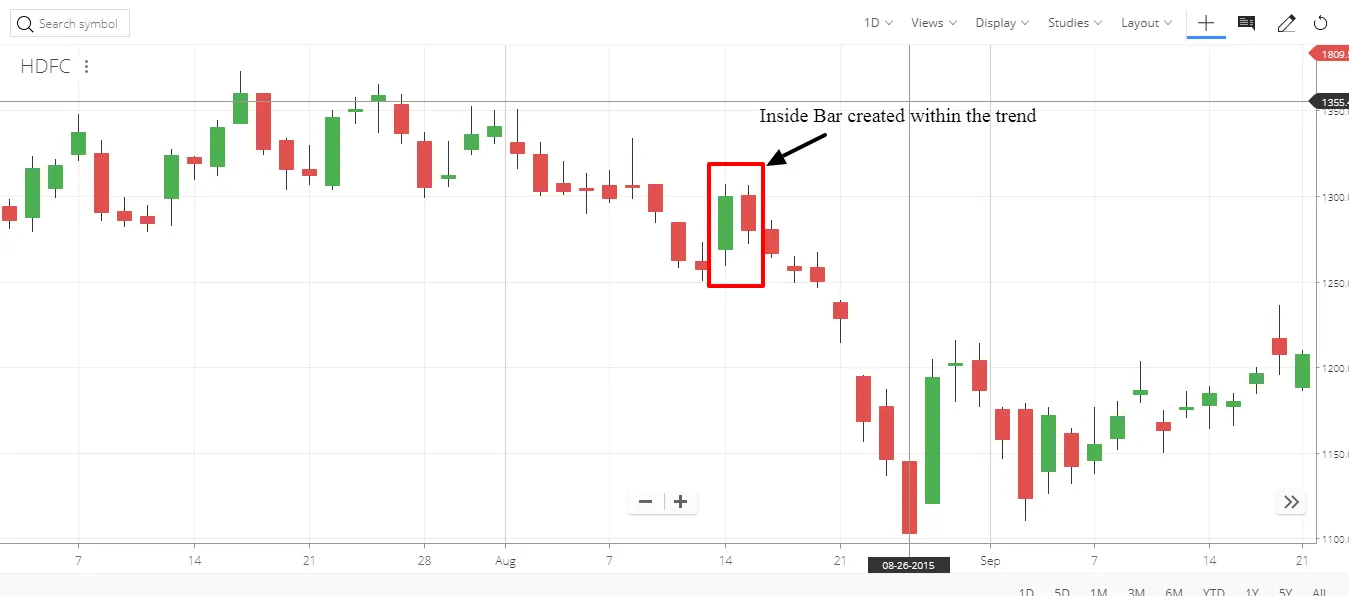
As shown in the above image of HDFC an inside bar is created in the direction of trend only which confirm and support the direction of a trend. So a short trade can be initiated after completion of inside bar pattern.
Winning Edge
An ideal Trader would use a method which has a very robust edge, even if its winning ratio is too small. Depending upon your risk: reward, the winning ratio could be as low as 25% of all trades.
The higher the risk: reward ratio, lower is the required win ratio and vice versa.
A robust winning edge is a proven market and price event which acts as a signal for the trader to look after and create an order in the market.
You must learn to read charts, study price action and learn to act upon price action without any emotions.
Related Posts