eClerx Services Limited is a knowledge and business process outsourcing company with operations in the United States, the United Kingdom, Europe and the Asia Pacific
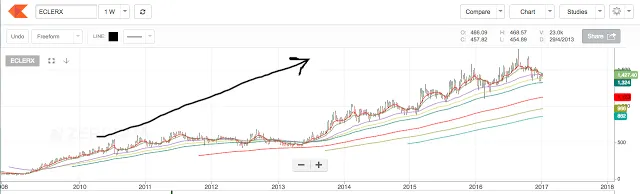
1. Its long-term trend is up as price is making a higher top higher bottom formation and mid and long-term EMA’s are moving upwards.
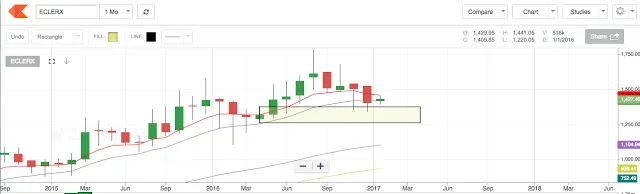
2. Price has hit the monthly demand zone of 1380 – 1279 and has moved upwards suggesting a good amount of accumulation has occurred in this zone.
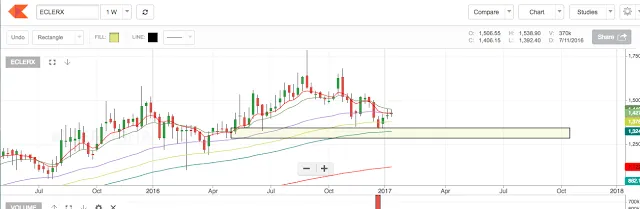
3. Price has hit the weekly demand zone of 1344 – 1290 adding more strength to the upward move.
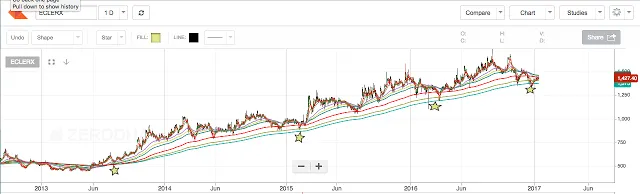
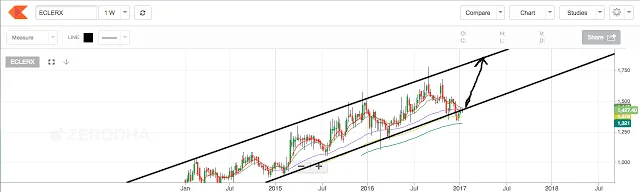
4. The price has a tendency to hit bounce from the 300 and 360 days EMA and historically, it has risen 50% from the price. As per that data, we can expect a price level of 2017 (50 % upside from 1350 where the 365 EMA based price reversal occurred)
5. Since two years, the price has been moving in an ascending channel and the current price is at the channel support at 1427. The channel resistance is around 1866 which is 31% of the current market price.
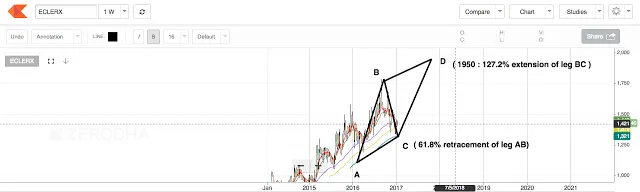
6. By observing the price action keenly, one can see an AB= CD harmonic pattern in progress.
AB leg is 1106 to 1784. BC leg ends at approximately 61.8% retracement of AB leg. This Fibonacci retracement level is most often a strong support area. The projection of point D can be made by taking 127.2% extension of leg BC and it comes out to 1950 which is 36% up from the cmp of 1427.
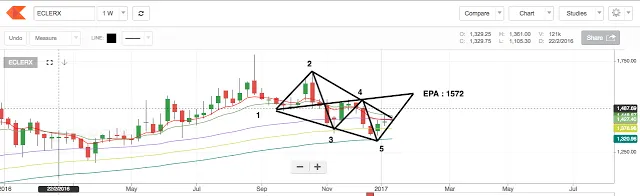
7. We can observe a bullish Wolfe wave which can be useful for the short-term trader. The target for the wave is at 1572 ( 11% from cmp of 1427)
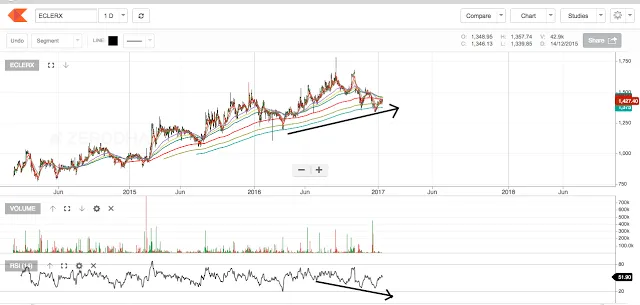
8. The last sign of an upward move is the Hidden Bullish Divergence. Price is making a higher high and the RSI(14) is making a lower low. This is an indication that the price will move higher from the current level.
All these points lead us towards a high probability up move which can be cashed in for a 35-50% upside in the near term (6-8 months)
P.S.: This analysis is invalid below 1110.
Related Posts