In the Google spreadsheet below, you’ll find an exceptional tool for conducting backtests on various pairs using this concept. Feel free to evaluate the performance across different pairs of stocks.*

How to use the sheets

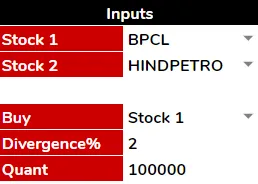
Step 1: Select the pair trading instruments as Stock 1 and Stock 2.
Step 2: Select which stock to be bought when the signal comes.
Step 3: Select the divergence from of price ratio from 50 days average ratio which would signal a Pair Trading opportunity.
Step 4: Select the Investment amount per stock for Pair Trading.

The sheet will show complete backtesting report of a pair trading strategy based on the pre-defined divergence of the price ratio from the 50 days average. When the signal comes, one has to go long in one stock and short the other

Example on How to use the Pair Trading Tool

Let’s talk about a few stocks which are highly co-related.

  • Hindalco/Nalco – Both are related to Alumunium mining.
  • Asian paints/Berger paints – Both are paint companies and their profit are tied up with the price of crude oil.

Or, We can just pick two companies from the same sectors like HDFC Bank and Kotak bank as they are both private bank. Although this is a naive way to look at the things it will serve the current purpose.

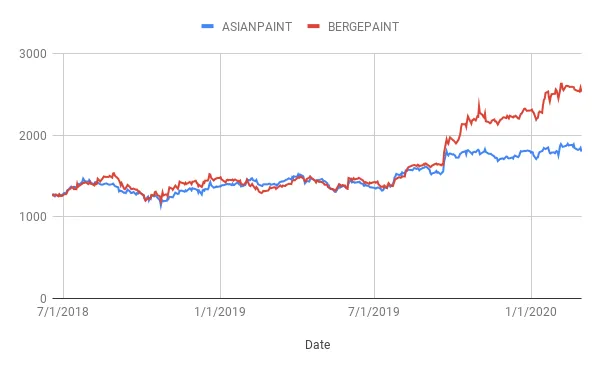
Here is a comparison of Berger paints with respect to Asian Paints. We can clearly see that Berger paints went up like beast lately creating a divergence.

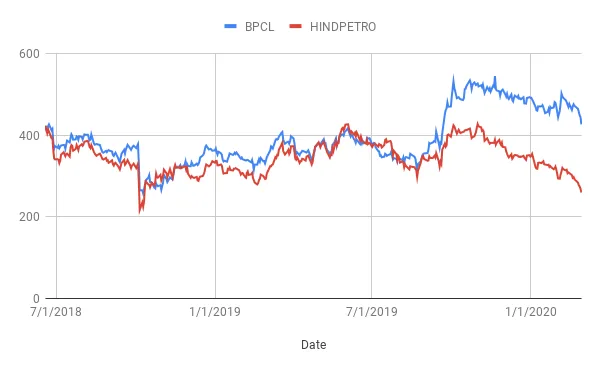
Here is another example of a comparison between BPCL and Hindpetro – both are oil marketing companies.

Now, what if, we sell the stock that is going up from this pair and buy the stock that is going down from this highly correlated pair. Because of this correlation, We are assuming that the divergence between their prices should also decrease. This creates a market neutral strategy. We call it pair trading.

Although over the long term, The company fundamentals kick in but in the short term, it works fairly. (That’s why we take 50 days average ratio here.) The basic idea is that the short position would profit more than the long position when the co-relation is weak and, vice versa.

*Please be aware that occasional freezing of the sheet might occur due to data retrieval from Google Finance.

Join The Conversation?