Double Short Straddle

A Double Short Straddle involves selling two sets of straddle options (a call and a put) at different strike prices on the same underlying asset. This strategy is more complex and risky than a standard Short Straddle due to the additional options involved.
The choice of strike prices depends on the trader’s market analysis and expectations.
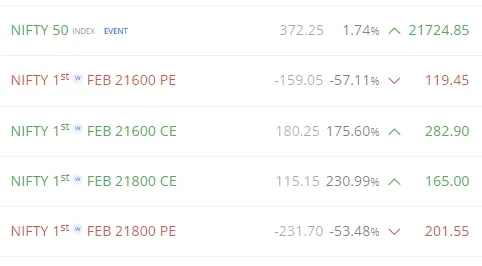
NIFTY is trading at 21724.85.
So, Let’s explore Double Short Straddle in this context.
- Short Straddle at 21600.
- Short Straddle at 21800.
The prices of Call Options and Put options can be seen in the image shared above. Now, Let’s plot the payoff graph in the same range so visualize it in the same scale.
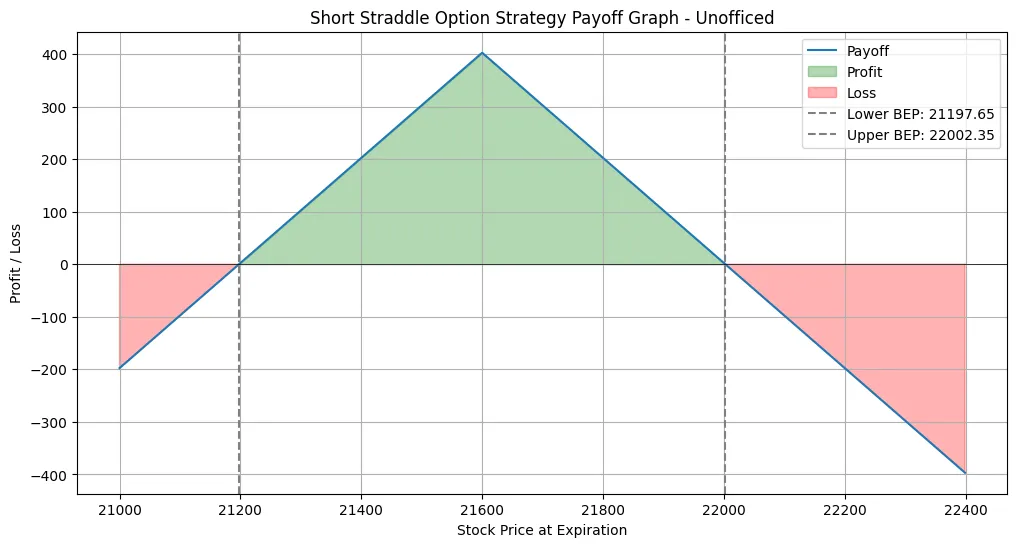
This is the payoff graph of 21600 straddle in the range of 21000-22400.
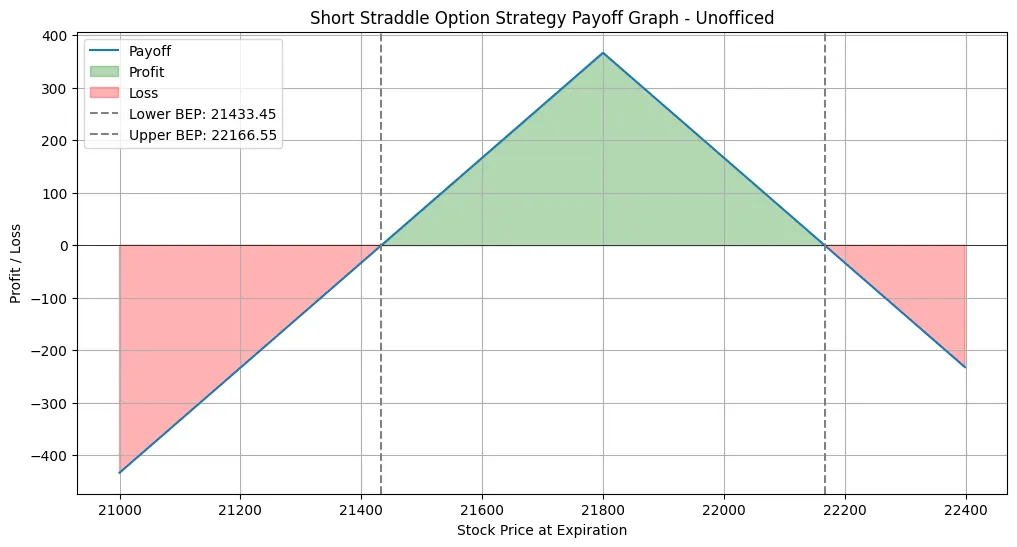
This is the payoff graph of 21800 straddle in the range of 21000-22400.
So, what happens when we combine both straddles in options trading?
Do we end up with another ‘Batman’, given that it might also have two pointy sections in the graph?
It’s an interesting question, especially considering the visual aspects of options payoff graphs. Anyways, here is the combined payoff graph –
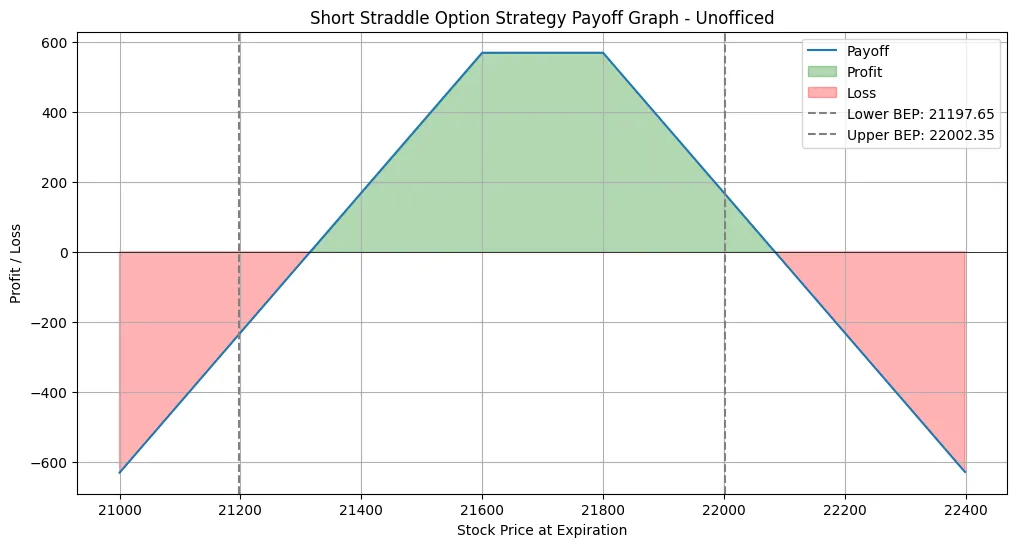
The combined payoff graph here resembles the payoff graph of a short strangle! Isn’t it?
Middle Section Difference: Unlike the Batman payoff graph which shows a small loss in the middle, this combined strategy depicts a profit in that section. This is due to the overlapping profit ranges.
Double Short Straddle = Short Strangle + Inverse Short Strangle
Also, Notice this interesting fact =
Short Straddle at 21600 + Short Straddle at 21800
= Short 21600PE + Short 21600CE + Short 21800PE + Short 21800CE
= Short 21600PE + Short 21600CE + Short 21800PE + Short 21800CE
= Short 21600PE + Short 21800CE+ Short 21800PE + Short 21600CE
= Short Strangle at (21600-21800) + Inverse Short Strangle at (21600-21800)
So, the primary risk involved is akin to selling two strangles, suggesting significant risk exposure if the underlying asset moves beyond the range of the sold options.
But, What happens if we choose the strikes far? Will the middle section difference come?
Let’s choose 21200 which is far beyond our breakeven point of the Double Short Straddle strategies discussed!
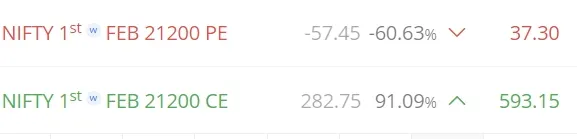
- NIFTY 21200PE is trading at 37.3
- NIFTY 21200CE is trading at 593.15
The problem is choosing a far strike price in a short straddle is –
The premium of one leg will be almost negligible compared to the other leg and it will disbalance our delta!
So, here is the payoff graph in the range of 20700 and 22300 –
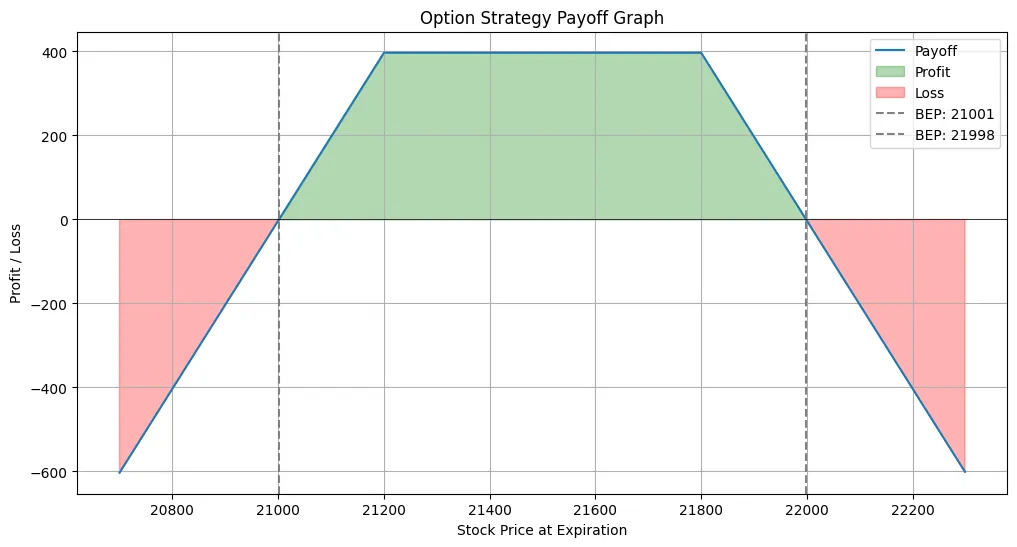
So, Creating a ‘Batman’ shape in an options payoff graph is not achievable with the combination of two straddles.
Moreover, it has been theoretically established that two straddles are equivalent to two strangles in certain respects.
The Double Short Straddle strategy, known for its expanded breakeven points, is often recognized as an effective adjustment strategy for Short Straddles. This adjustment offers a unique risk-reward profile and is used to optimize the performance of Short Straddle positions.
Key Aspects of the Double Short Straddle:
Increased Premium Collection:
By selling two sets of straddles, the trader can collect more premiums, potentially increasing the profit range.
Expanded Breakeven Points:
The strategy has wider breakeven points, which can provide a larger margin for error compared to a single short straddle.
Higher Risk:
Along with increased potential returns, the strategy carries higher risk, especially if the underlying asset moves significantly.
Market Outlook:
Best suited for markets where the underlying asset is expected to have limited movement.
Complexity in Management:
Managing this strategy can be complex, requiring constant monitoring and potential adjustments in response to market movements.