Accelerator Indicator

The Accelerator Oscillator (AC) is a technical indicator developed by Bill Williams to measure the rate of change of market momentum. Think of it as the market’s “acceleration.” While momentum indicators tell you the speed of price changes, the AC indicator tells you if that speed is increasing or decreasing. It acts as an early warning signal, often changing direction before price and even before momentum itself, giving traders a potential edge in anticipating trend shifts.
The AC is a core component of Williams’ “Trading Chaos” methodology, designed to be used in conjunction with the Awesome Oscillator (AO) and the Alligator indicator. It aims to capture the very first signs that a trend’s driving force is waning or strengthening.
The Mathematics Behind the Accelerator Oscillator
To understand the Accelerator Oscillator, we must first understand its foundation: the Awesome Oscillator (AO). Both are derived from the simple moving average of a bar’s median price.
First, we calculate the Median Price for each period:
Next, we calculate the Awesome Oscillator (AO). The AO represents the market’s momentum by comparing a short-term 5-period simple moving average (SMA) of the median price to a longer-term 34-period SMA.
Finally, the Accelerator Oscillator (AC) is calculated as the difference between the Awesome Oscillator and a 5-period SMA of the AO. This essentially gives us the rate of change of the momentum (the AO).
The AC is therefore an oscillator of an oscillator, measuring the acceleration or deceleration of market momentum.
How to Calculate the Accelerator Oscillator: A Step-by-Step Example
Let’s walk through a simplified calculation with a few data points.
| Bar | High | Low | Median Price | 5p SMA (MP) | 34p SMA (MP) | AO | 5p SMA (AO) | AC |
|---|---|---|---|---|---|---|---|---|
| 1 | 102 | 100 | 101.0 | … | … | … | … | … |
| … | … | … | … | … | … | … | … | … |
| 34 | 115 | 113 | 114.0 | 112.0 | 107.0 | 5.0 | … | … |
| 35 | 116 | 114 | 115.0 | 113.0 | 107.5 | 5.5 | … | … |
| 36 | 118 | 116 | 117.0 | 114.5 | 108.0 | 6.5 | 5.0 | 1.5 |
| 37 | 120 | 118 | 119.0 | 116.0 | 108.5 | 7.5 | 5.8 | 1.7 |
| 38 | 122 | 120 | 121.0 | 117.2 | 109.2 | 8.0 | 6.5 | 1.5 |
- Calculate Median Price: For bar 38, (122 + 120) / 2 = 121.0.
- Calculate SMAs of Median Price: Calculate the 5-period and 34-period SMAs of the Median Price column. This requires at least 34 bars of data.
- Calculate Awesome Oscillator (AO): For bar 38, assume the 5p SMA is 117.2 and 34p SMA is 109.2. The AO is 117.2 – 109.2 = 8.0.
- Calculate 5-period SMA of AO: Calculate the moving average of the last 5 AO values. For bar 38, let’s assume this is 6.5.
- Calculate Accelerator Oscillator (AC): For bar 38, the AC is AO – SMA(AO, 5) = 8.0 – 6.5 = 1.5.
How to Read the Accelerator Oscillator
The AC is displayed as a histogram with red and green bars fluctuating around a zero line.
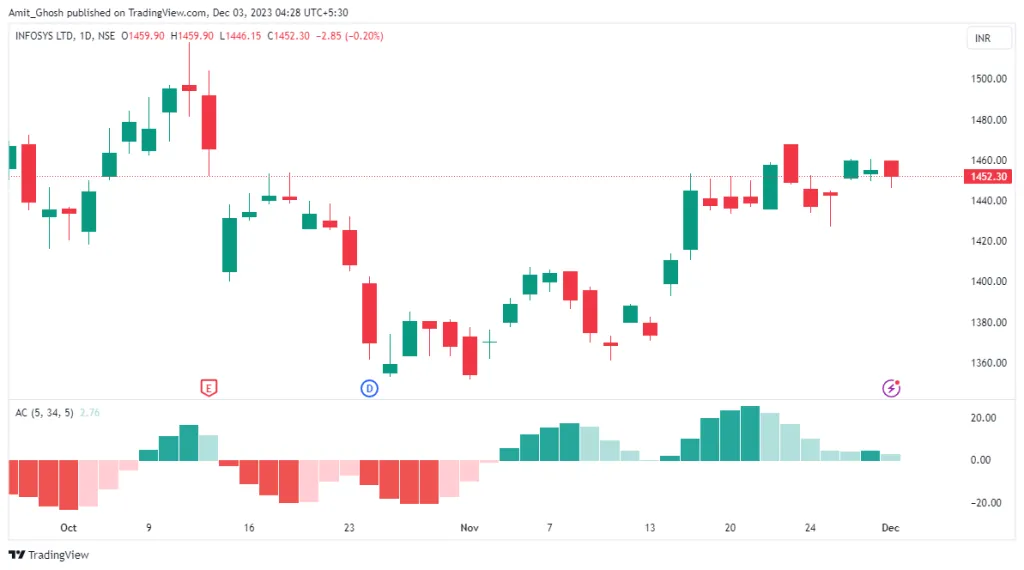
- The Zero Line: This is the point of equilibrium, where momentum’s acceleration is zero. Price momentum is neither increasing nor decreasing.
- Green Bars: A green bar indicates that the acceleration is increasing (or decelerating less negatively). A green bar forms when the current AC value is higher than the previous bar’s AC value. This is bullish, regardless of whether it’s above or below the zero line.
- Red Bars: A red bar indicates that acceleration is decreasing (or decelerating more rapidly). A red bar forms when the current AC value is lower than the previous bar’s AC value. This is bearish, regardless of position relative to the zero line.
Trading Signals with the Accelerator Oscillator
Bill Williams defined specific, non-negotiable rules for trading with the AC. He stressed that one should not sell when the AC is green and not buy when it is red.
1. Buy Signal Above the Zero Line
This is a signal to enter a long position or add to an existing one in an established uptrend.
- Condition: The AC histogram is above the zero line.
- Signal: Look for two consecutive green bars.
- Action: Place a buy stop order a few ticks above the high of the price bar that corresponds to the second green AC bar.
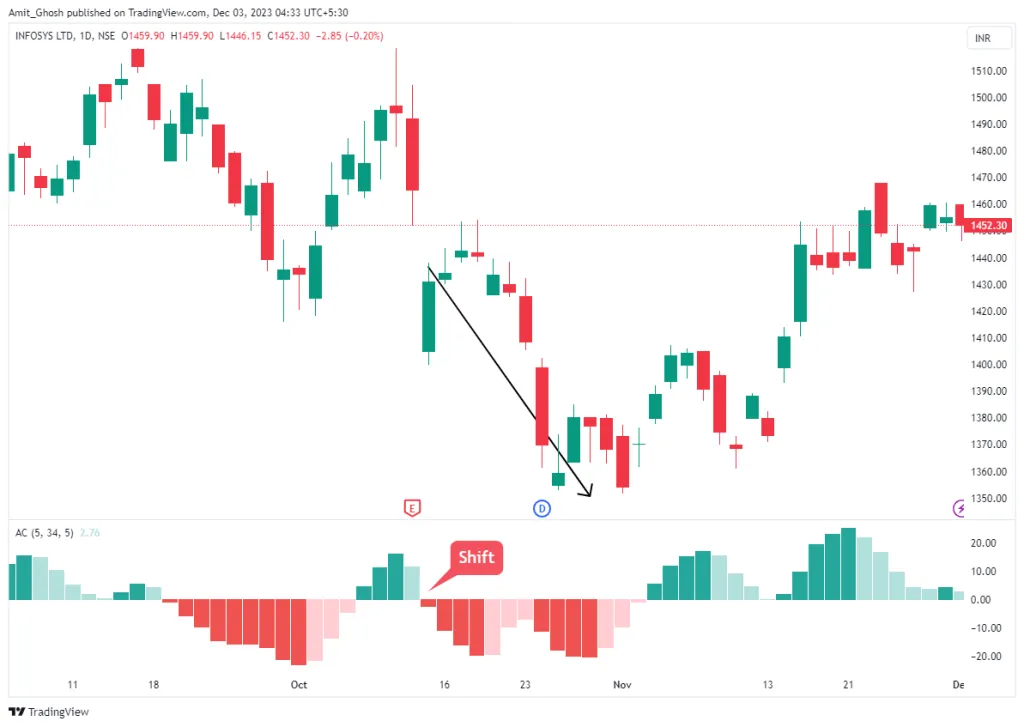
2. Sell Signal Below the Zero Line
This is a signal to enter a short position or add to it in a clear downtrend.
- Condition: The AC histogram is below the zero line.
- Signal: Look for two consecutive red bars.
- Action: Place a sell stop order a few ticks below the low of the price bar that corresponds to the second red AC bar.
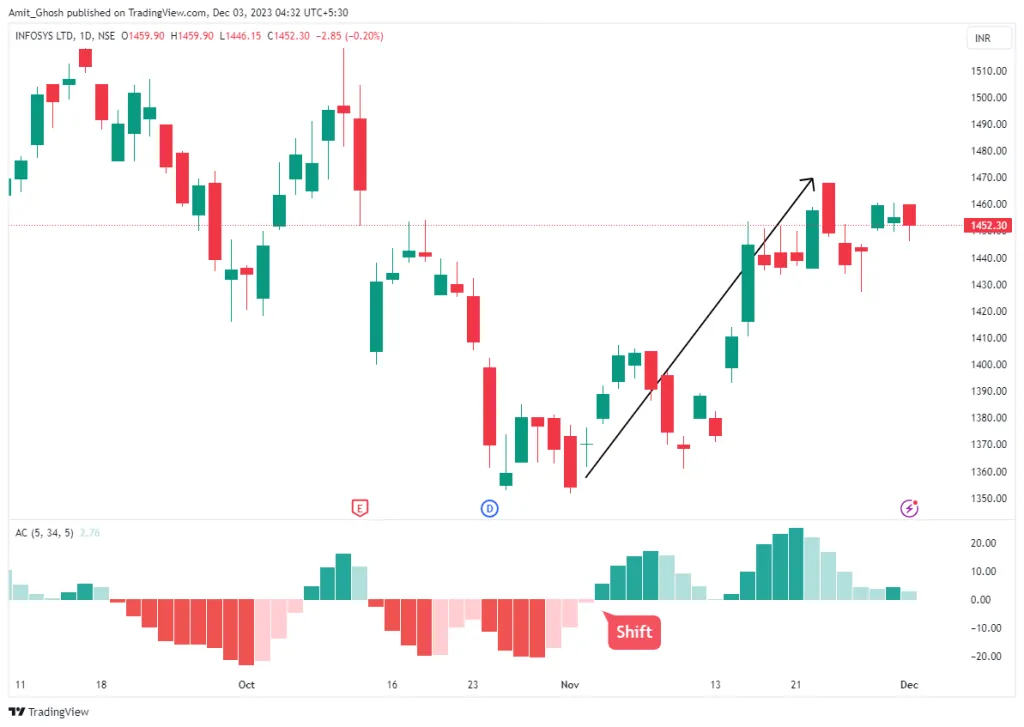
3. Buy Signal Below the Zero Line (Early Entry)
This is a more aggressive signal, aiming to catch the absolute beginning of a potential reversal from a downtrend to an uptrend.
- Condition: The AC histogram is below the zero line.
- Signal: Look for two consecutive green bars. This shows the downward momentum is decelerating and starting to turn.
- Action: Place a buy stop order a few ticks above the high of the price bar corresponding to the second green AC bar.
4. Sell Signal Above the Zero Line (Early Exit/Entry)
This signal warns that an uptrend is losing its driving force and might be about to reverse.
- Condition: The AC histogram is above the zero line.
- Signal: Look for two consecutive red bars. This indicates that bullish momentum is decelerating.
- Action: Place a sell stop order a few ticks below the low of the price bar corresponding to the second red AC bar.
Primary Trading Uses of the Accelerator Oscillator
- Early Trend Reversal Detection: Its primary strength is in signalling a change in the market’s driving force before price confirms a new trend. The buy-below-zero and sell-above-zero signals are classic examples.
- Confirmation of Trend Strength: During a strong uptrend, you would expect to see a series of tall green bars above the zero line. In a strong downtrend, a series of deep red bars below zero confirms the bearish momentum.
- Trade Entry and Management: The specific two-bar and three-bar patterns provide clear, objective entry points for trades. They can also be used to add to existing positions that are moving in your favour.
Best Timeframes for Indian Markets
For traders in the Indian markets, the effectiveness of the Accelerator Oscillator can vary with the chosen timeframe and instrument.
- Intraday Trading: For liquid F&O stocks and indices like NIFTY and BANKNIFTY, the 15-minute chart often provides a good balance between responsiveness and signal reliability. Shorter timeframes (1-min, 5-min) tend to be very noisy and can produce many false signals.
- Swing Trading: The 1-hour and Daily charts are excellent for swing trading positions held over several days or weeks. On these higher timeframes, the signals from the AC are more significant and reflect a more substantial shift in market sentiment.
The default settings (5, 34, 5) are standard and generally work well. Adjusting them is not recommended unless you have a deep understanding of the indicator’s mechanics and have thoroughly backtested your alternative settings.