Moving Average

A moving average is a technical indicator that smooths out price data by creating a constantly updated average price. Traders use it to identify the direction and strength of a trend, filtering out the day-to-day noise of market fluctuations.
The simple moving average — formula and intuition
The Simple Moving Average (SMA) is the most basic form of the indicator. It is calculated by summing the closing prices of the last n periods and then dividing that sum by n. It is a simple, unweighted arithmetic mean.
The formula for the SMA at time t over an n-period lookback window is:
Here, is the price at time . The calculation is a “moving” or “rolling” window across the price series. As a new price bar forms, the oldest price bar in the window is dropped and the new one is added.
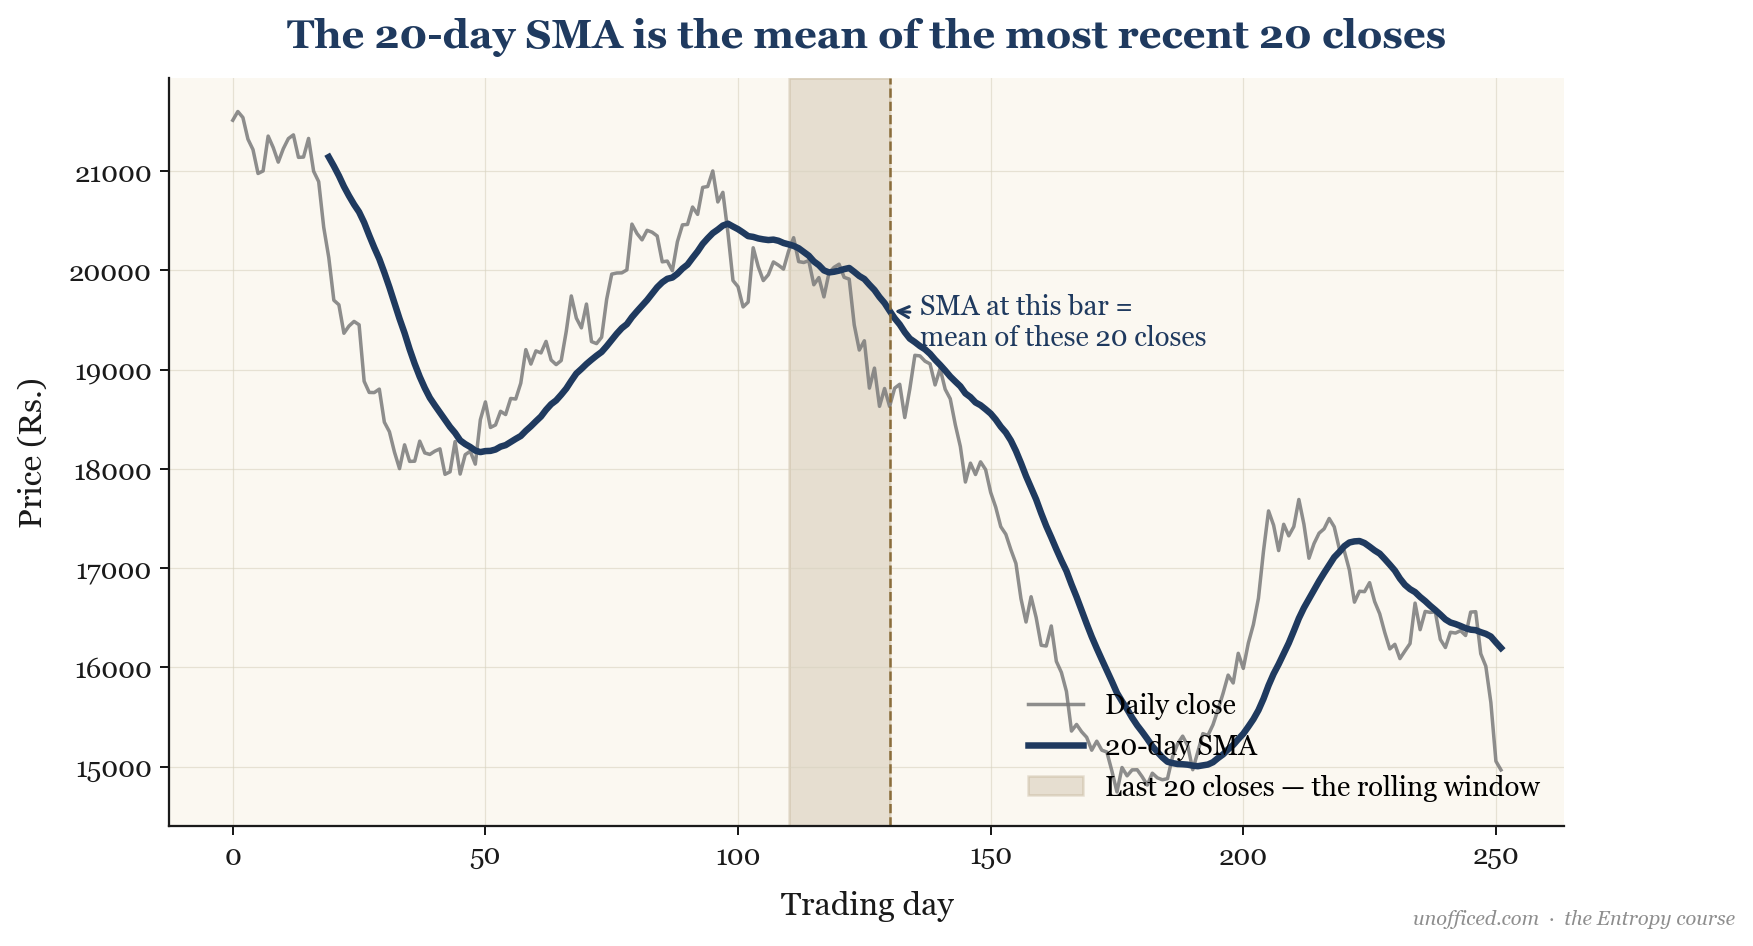
For a concrete example, consider the last five closing prices for a NIFTY futures contract: Rs. 21,540, Rs. 21,605, Rs. 21,520, Rs. 21,610, and Rs. 21,655. The 5-period SMA is calculated as:
How traders use the moving average
Traders use moving averages primarily for two purposes: identifying trend direction and locating dynamic support or resistance levels.
Trend Direction
The simplest use is to gauge the trend. If the price is consistently trading above a moving average and the MA itself is sloping upwards, the trend is considered bullish. Conversely, if the price is below a downward-sloping MA, the trend is bearish. The steepness of the MA’s slope can indicate the momentum of the trend.
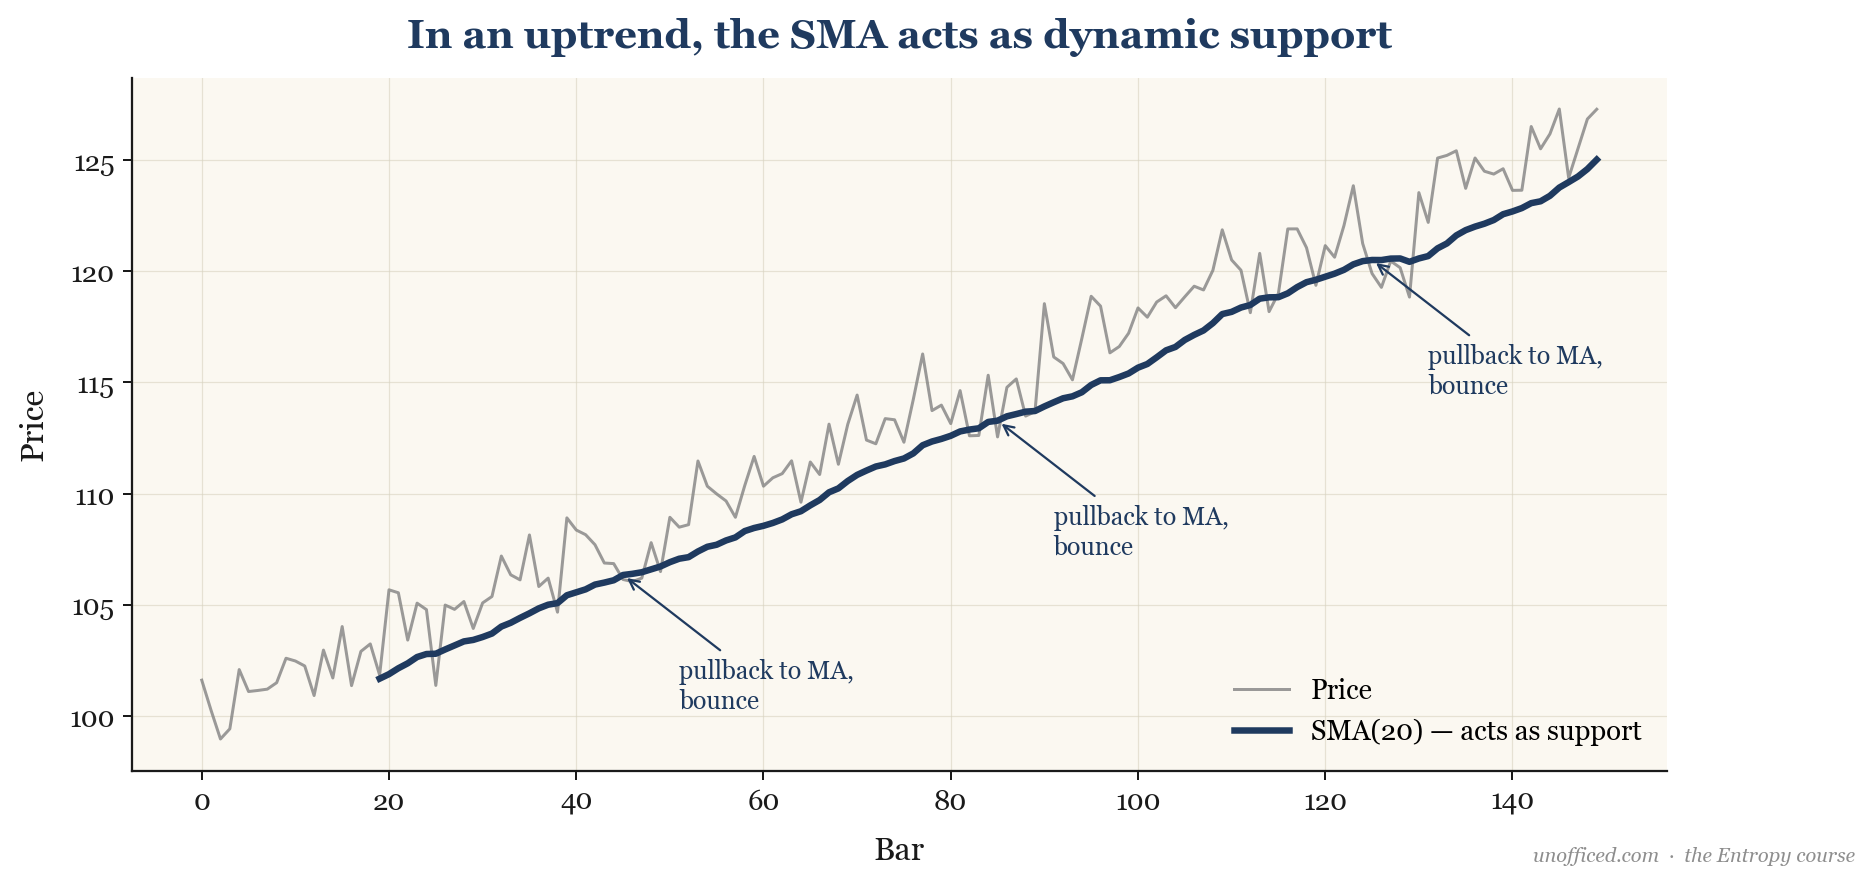
Support and Resistance
In a trending market, a moving average often acts as a dynamic level of support (in an uptrend) or resistance (in a downtrend). Price will pull back to the moving average during minor corrections before resuming the trend. This provides a high-probability area to enter a trade in the direction of the trend.
Choosing the MA period involves a trade-off between sensitivity and reliability.
| Period (n) | Typical Use Case | Speed | Reliability |
|---|---|---|---|
| 10, 20 | Short-term, intraday trading (e.g., 15-min chart) | Fast, responsive | Less reliable, prone to “whipsaws” |
| 50 | Medium-term trend, swing trading (e.g., hourly/daily chart) | Moderate | Balanced |
| 200 | Long-term trend, investment (e.g., daily/weekly chart) | Slow, lagging | More reliable, confirms major trends |
Types of moving averages
While the SMA is common, several other types of moving averages exist. They differ in how they weight the price data. The goal of these variations is typically to reduce the lag inherent in the SMA.
- Simple Moving Average (SMA): As discussed, gives equal weight to all prices.
- Exponential Moving Average (EMA): Gives more weight to recent prices, making it more responsive to new information.
- Double Exponential Moving Average (DEMA): An even faster-reacting average that further reduces lag by taking a smoothed average of an EMA.
- Weighted Moving Average (WMA): Similar to EMA, it assigns more weight to recent prices, but does so in a linear fashion.
The EMA is calculated recursively. The formula uses a smoothing factor , which is derived from the period n.
The DEMA is a refinement of the EMA, not of the price itself. It is defined as:
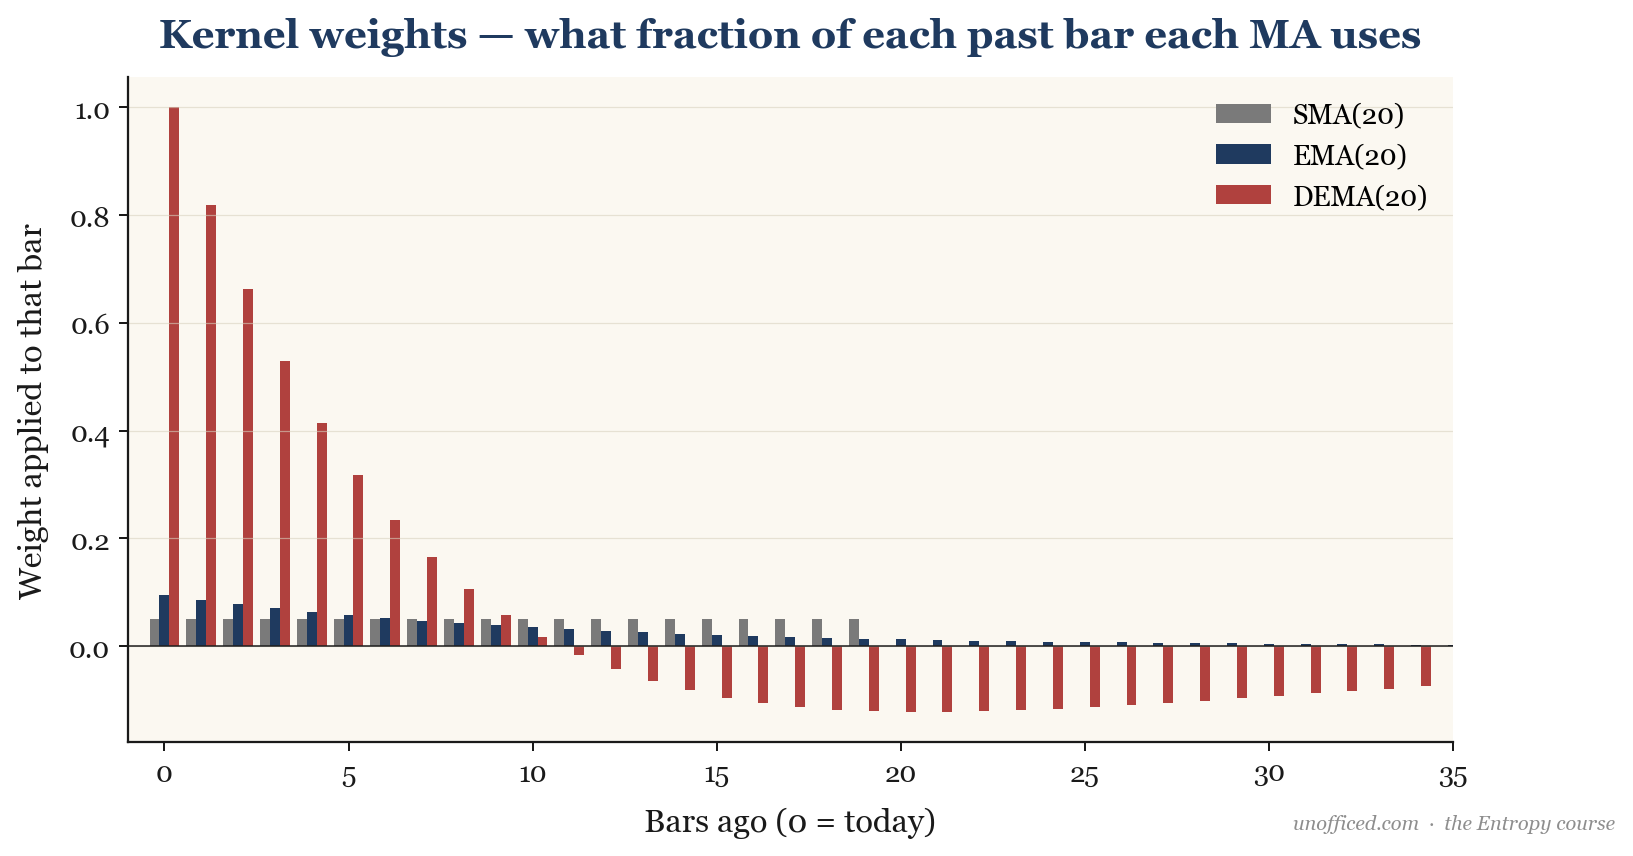
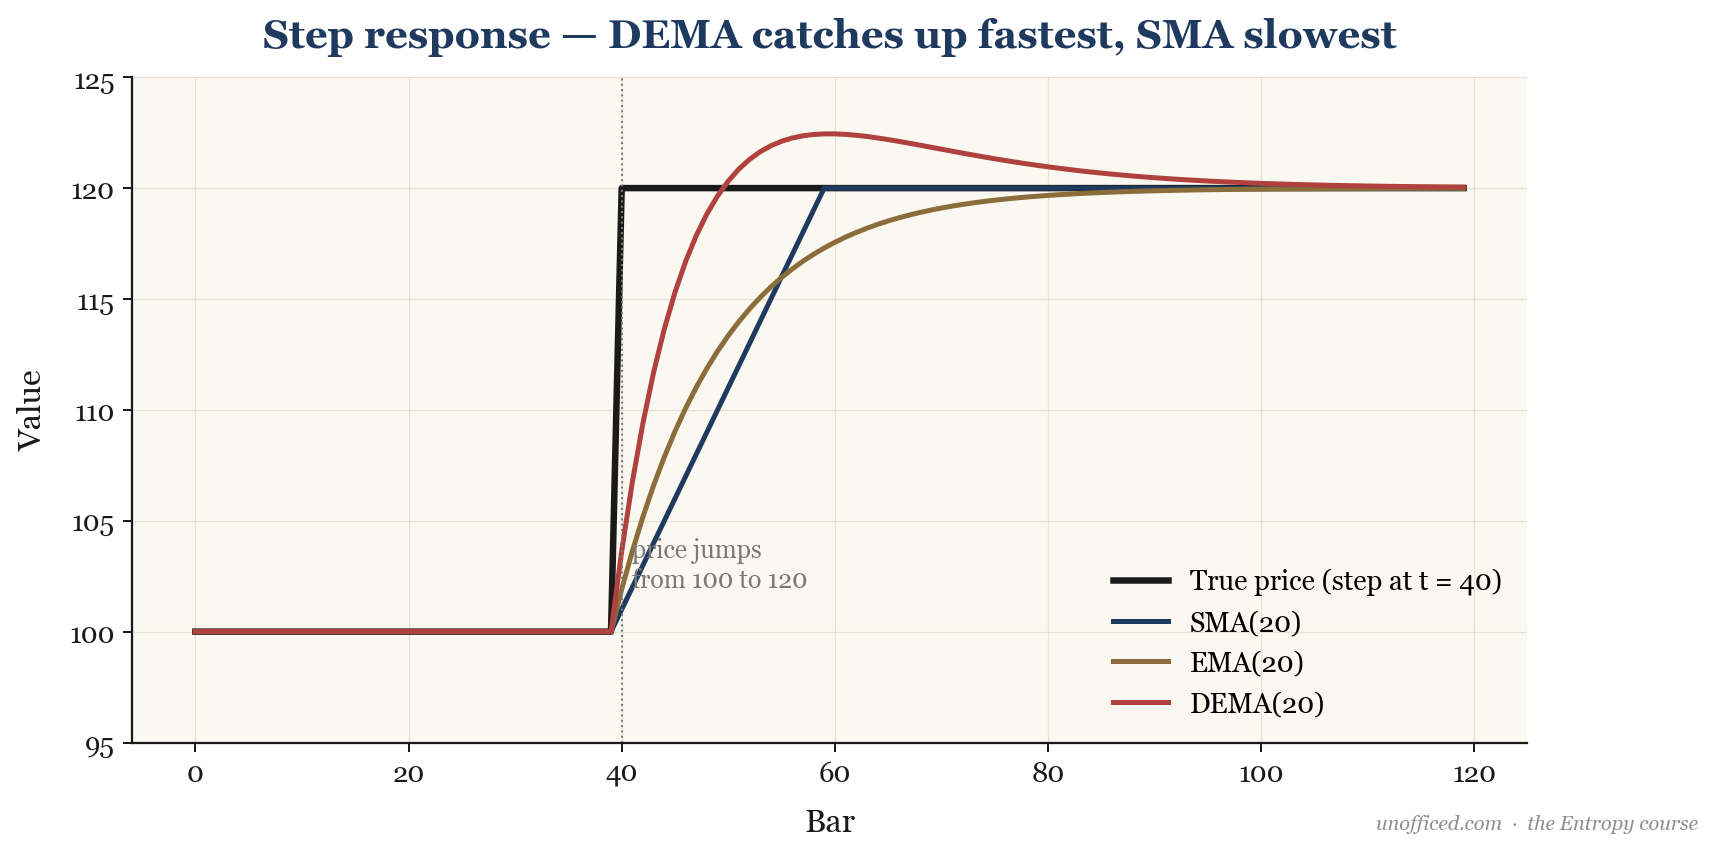
The difference in weighting, or the “kernel,” is what distinguishes these averages. The SMA has a flat, uniform kernel, while the EMA and DEMA have kernels that decay exponentially, focusing more weight on the most recent bars.
On a chart, this translates to the EMA and DEMA hugging the price more closely than the SMA.
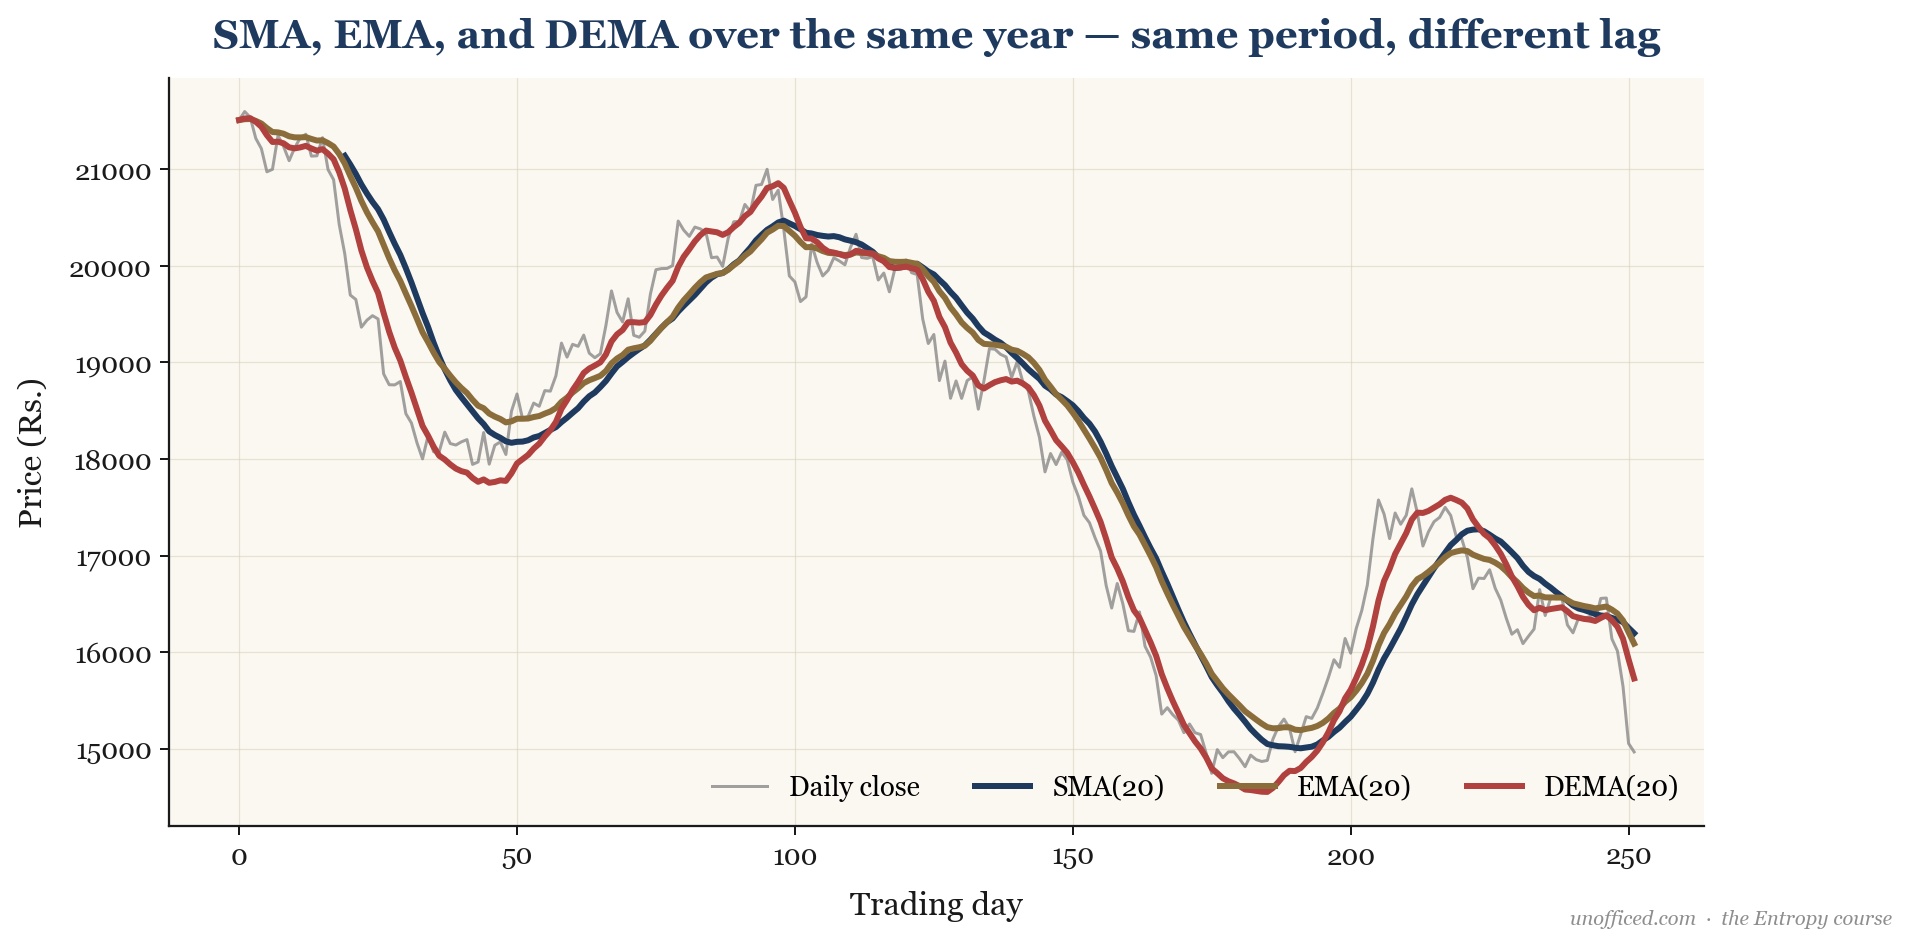
The practical benefit is reduced lag. When price makes a sudden move, the DEMA will react the fastest, followed by the EMA, and then the SMA. DEMA’s construction mathematically attempts to cancel out the inherent lag of a standard exponential moving average.
Moving-average crossovers
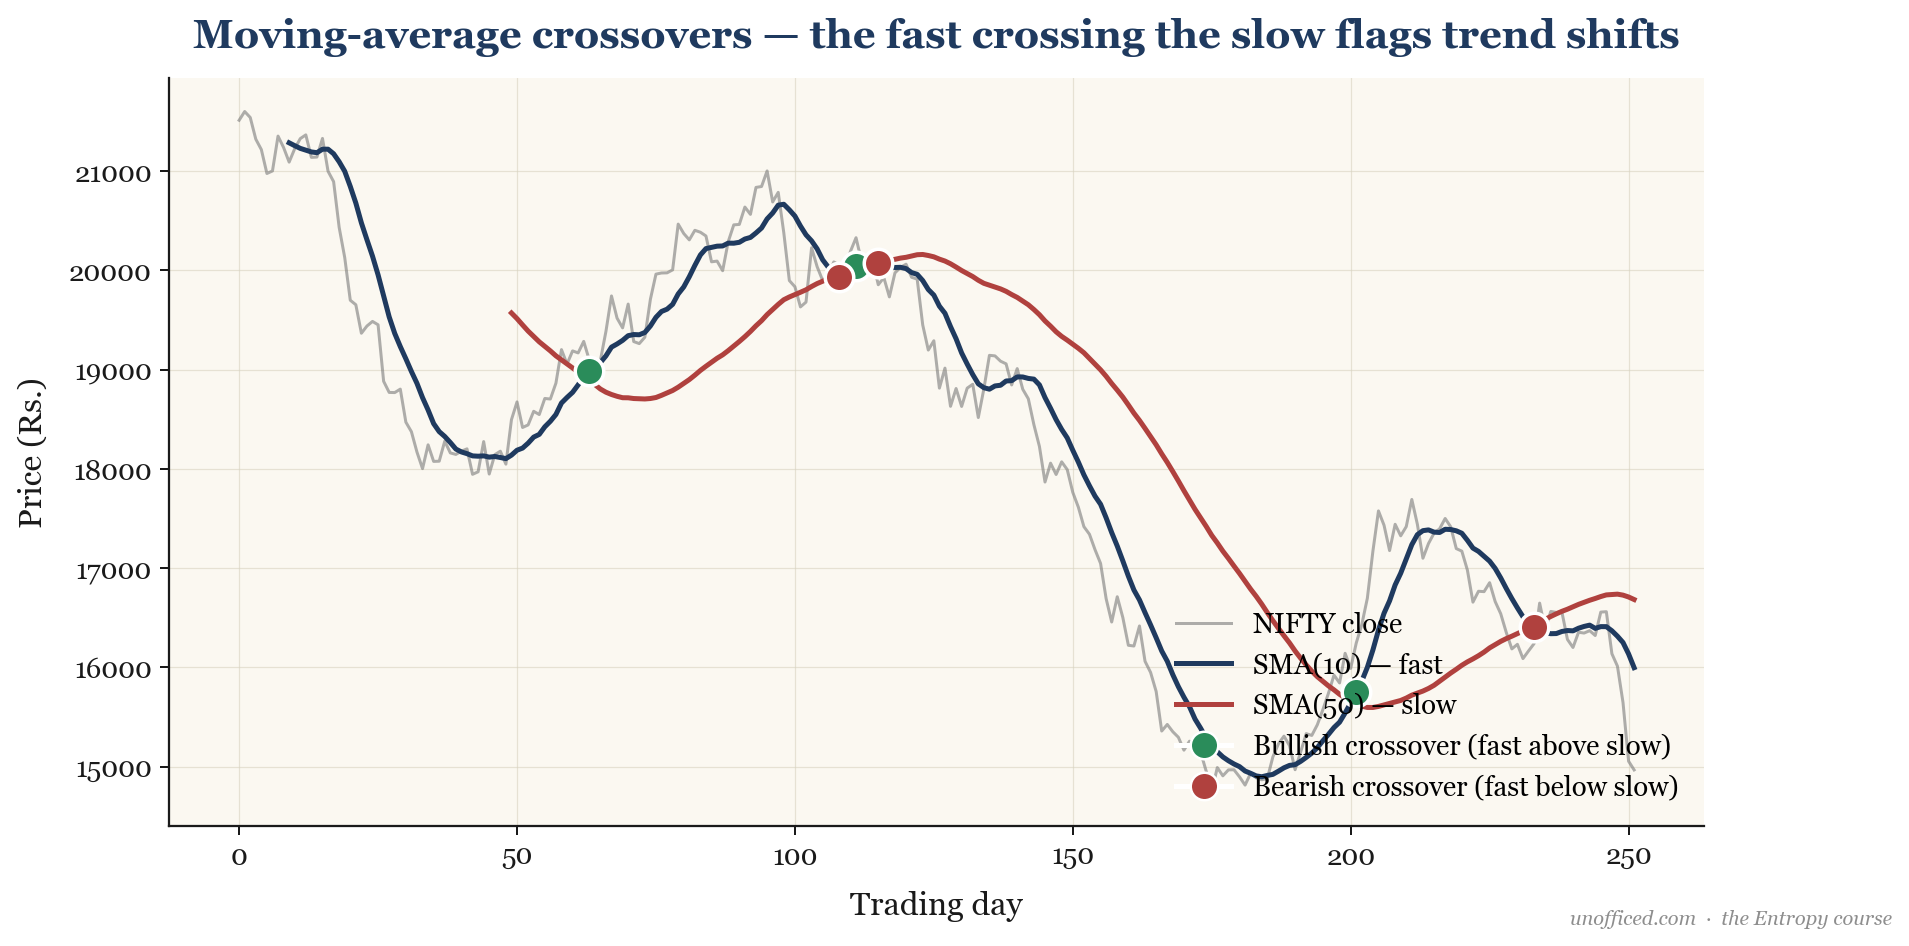
A popular trading strategy involves plotting two moving averages with different periods—a “fast” MA and a “slow” MA (e.g., 10-period and 50-period, or 50-period and 200-period). A trading signal is generated when the two MAs cross.
- A bullish crossover (or “golden cross”) occurs when the fast MA crosses above the slow MA. This suggests upward momentum is building.
- A bearish crossover (or “death cross”) occurs when the fast MA crosses below the slow MA. This suggests downward momentum is building.
Summary
This lesson covered the foundational concepts of the moving average indicator.
- A moving average smooths price data to reveal the underlying trend.
- Traders use it to determine trend direction and identify dynamic support/resistance levels.
- The choice of period (e.g., 20, 50, 200) is a trade-off between responsiveness and reliability.
- Different types exist (SMA, EMA, DEMA), which primarily vary by how they weight recent price data to reduce lag.
- The crossover of a fast and slow moving average is a common method for generating trend-following trade signals, though it is a lagging technique.
In the next lesson, we will see how the moving average forms the core component of Bollinger Bands, a volatility envelope.