Backtesting Parabolic SAR Trading Strategy in Tradingview

Building on our previous lesson, where we introduced the core logic of the Parabolic SAR trading strategy, this chapter focuses on its practical implementation and backtesting. We will use TradingView’s Pine Script to build a robust strategy, apply it to NIFTY futures, and analyze its performance across various timeframes. This process is essential for any algorithmic trader to validate a strategy’s effectiveness before deploying it with real capital.
Mathematical Underpinnings of Parabolic SAR
Before diving into the code, it is crucial to understand the mathematics that power the Parabolic SAR. The indicator is iterative, meaning each new SAR value depends on the previous one. The core formula is designed to “catch up” to the price, moving faster as the trend accelerates.
The calculation differs for uptrends and downtrends.
For an Uptrend:
For a Downtrend:
Where:
- is the Parabolic SAR value for the next period.
- is the SAR value for the current period.
- (Extreme Point) is the highest high in the current uptrend or the lowest low in the current downtrend.
- (Acceleration Factor) is a variable that controls the sensitivity of the SAR. It starts at a specified value (typically 0.02) and increases by a step (also 0.02) each time a new EP is recorded, up to a maximum cap (typically 0.20). The AF resets to its initial value whenever the trend reverses.
A trend reversal occurs when the price crosses the SAR value. In an uptrend, if the low of a candle drops below the SAR, a downtrend begins. Conversely, in a downtrend, if the high of a candle rises above the SAR, an uptrend begins.
A Worked Example with NIFTY
Let’s illustrate with a synthetic 5-day NIFTY price series, using an initial of 0.02, a step of 0.02, and a cap of 0.20.
| Day | High | Low | Trend | EP | SAR | Calculation | |
|---|---|---|---|---|---|---|---|
| 1 | 18,550 | 18,480 | Uptrend | 18,550 | 0.02 | 18,480 | Initial SAR set to previous low. |
| 2 | 18,610 | 18,560 | Uptrend | 18,610 | 0.04 | 18,481.40 | . New High made, so increases. |
| 3 | 18,650 | 18,600 | Uptrend | 18,650 | 0.06 | 18,486.54 | . New High made, so increases. |
| 4 | 18,630 | 18,580 | Downtrend | 18,580 | 0.02 | 18,650 | Low (18,580) < SAR (18,593.08*). Trend reverses. SAR resets to previous EP (18,650). [latex]\alpha[/latex] resets. |
| 5 | 18,570 | 18,510 | Downtrend | 18,510 | 0.04 | 18,648.60 | . New Low made, so increases. |
*Note: The SAR for Day 4 would have been . Since the low of 18,580 is below this value, the trend flips.
Pine Script Strategy for Backtesting
The following Pine Script code implements the Parabolic SAR logic as a complete backtesting strategy in TradingView. It is open-source and can be used for your personal research.
// @version=5
strategy("Positional Parabolic SAR Strategy | Unofficed.com", overlay=true)

// --- INPUTS ---
initial = input.float(0.02, title="Initial AF")
step    = input.float(0.02, title="AF Step")
cap     = input.float(0.20, title="AF Cap")

// --- VARIABLES ---
var bool isUptrend = na
var float Extremum = na
var float SARValue = na
var float Accelerator = initial
var float futureSAR = na

// --- LOGIC ---
if bar_index > 0
    isNewTrendBar = false
    SARValue := futureSAR

    // Initialization on the second bar
    if bar_index == 1
        if close > close[1]
            isUptrend := true
            Extremum := high
            SARValue := low[1]
        else
            isUptrend := false
            Extremum := low
            SARValue := high[1]
        isNewTrendBar := true
        Accelerator := initial

    // Check for trend reversal
    if isUptrend
        if SARValue > low // Trend flips to down
            isNewTrendBar := true
            isUptrend := false
            SARValue := math.max(Extremum, high) // New SAR is the highest point of the prior uptrend
            Extremum := low
            Accelerator := initial
    else // isDowntrend
        if SARValue < high // Trend flips to up
            isNewTrendBar := true
            isUptrend := true
            SARValue := math.min(Extremum, low) // New SAR is the lowest point of the prior downtrend
            Extremum := high
            Accelerator := initial

    // Update EP and Accelerator if no reversal
    if not isNewTrendBar
        if isUptrend
            if high > Extremum
                Extremum := high
                Accelerator := math.min(Accelerator + step, cap)
        else // isDowntrend
            if low < Extremum
                Extremum := low
                Accelerator := math.min(Accelerator + step, cap)

    // SAR value adjustments to prevent it from moving inside the prior two bars
    if isUptrend
        SARValue := math.min(SARValue, low[1])
        if bar_index > 1
            SARValue := math.min(SARValue, low[2])
    else // isDowntrend
        SARValue := math.max(SARValue, high[1])
        if bar_index > 1
            SARValue := math.max(SARValue, high[2])

    // Calculate SAR for the next bar
    futureSAR := SARValue + Accelerator * (Extremum - SARValue)

    // --- STRATEGY ORDERS ---
    if barstate.isconfirmed
        if isUptrend
            strategy.entry("LongEntry", strategy.long, stop=futureSAR, comment="LongEntry")
            strategy.cancel("ShortEntry")
        else // isDowntrend
            strategy.entry("ShortEntry", strategy.short, stop=futureSAR, comment="ShortEntry")
            strategy.cancel("LongEntry")

// --- PLOTTING ---
plot(SARValue, "Current SAR", style=plot.style_cross, linewidth=2, color=color.new(color.white, 0))
plot(futureSAR, "Next SAR (Stop)", style=plot.style_cross, linewidth=2, color=color.new(color.red, 0))
You can access and use this strategy directly from the TradingView community scripts.
Access the Strategy Script on TradingView
Script Breakdown
@version=5: Specifies Pine Script version 5.strategy(...): Defines the script as a strategy named “Positional Parabolic SAR Strategy” and setsoverlay=trueto draw plots on the main price chart.initial, step, cap: These are user-configurable inputs for the Acceleration Factor parameters, with default values of 0.02, 0.02, and 0.20 respectively.- Variable Initialization: The
varkeyword is crucial here. It declares variables whose values persist across all historical bars, maintaining the state of the trend (isUptrend), the Extreme Point (Extremum), the SAR itself (SARValue), and the Accelerator (Accelerator). - Main Logic (
if bar_index > 0): The core calculation begins on the second bar of the dataset. It detects trend reversals by checking if the price has crossed the SAR. If a trend continues, it checks for a new Extreme Point (a higher high in an uptrend or lower low in a downtrend) and increases theAcceleratoraccordingly. - Entry and Exit Logic: The strategy uses stop orders for entries. For example, if the calculated
futureSARfor the next bar is 18500 in a downtrend, a short entry is placed with a stop at 18500. This means a long position is initiated if the price rises to cross the SAR line. Thestrategy.cancelfunction ensures that only one type of entry order (long or short) is active at any time. - Visualization: The
plot()functions draw the current SAR value and the projected SAR for the next bar, which serves as the entry stop.
Backtesting on NIFTY Futures
For a realistic backtest in the Indian context, we use the NIFTY continuous futures contract (NIFTY1! in TradingView). This contract automatically rolls over to the next expiry, providing a seamless historical price series essential for long-term backtesting.
For this analysis, we set the initial capital to Rs. 10,00,000 and the order size to one contract. While the margin for one NIFTY lot fluctuates (currently around Rs. 1,50,000), this setup provides a consistent baseline to compare performance across different timeframes.
We will now run the backtest on timeframes ranging from 15 minutes to 1 month to observe how the strategy’s performance changes.
15-Minute Timeframe
Checkout The Results in Tradingview
30-Minute Timeframe
Checkout The Results in Tradingview
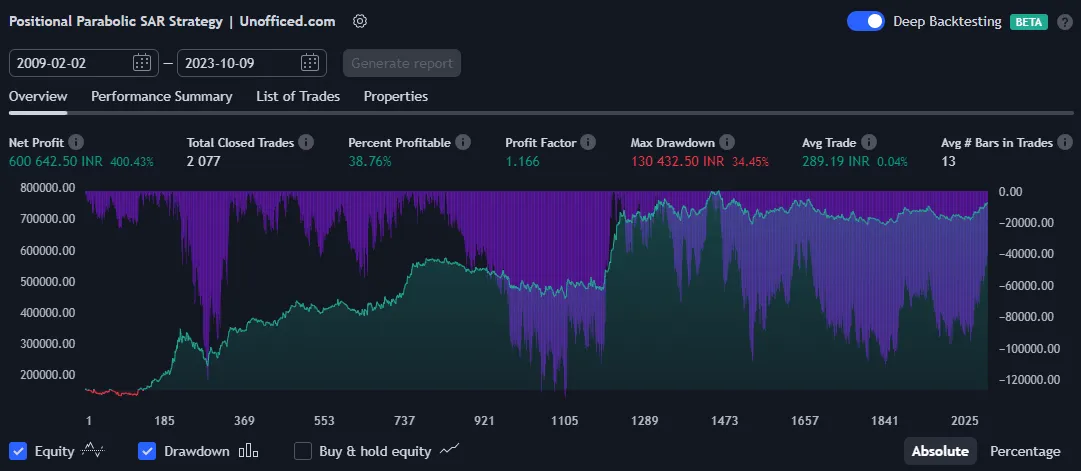
1-Hour Timeframe

Checkout The Results in Tradingview
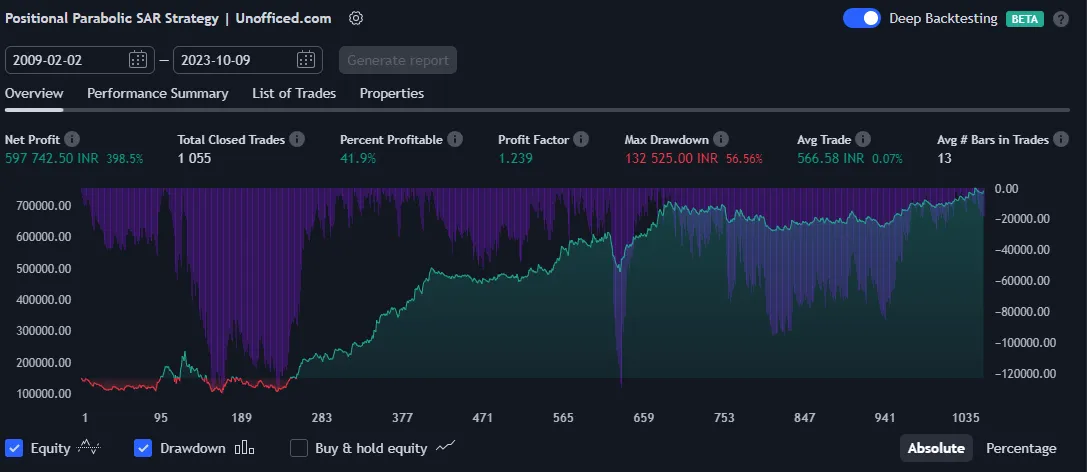
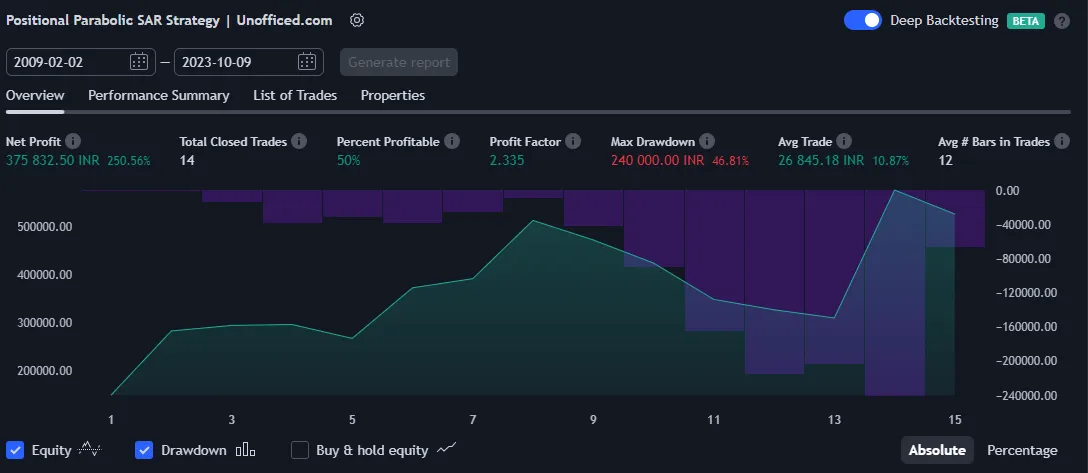
1-Day Timeframe
Checkout The Results in Tradingview
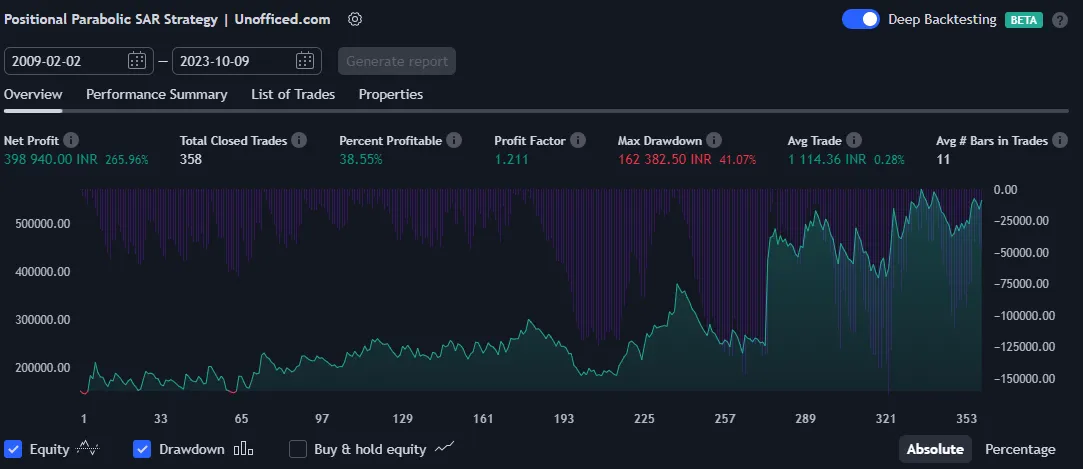
1-Week Timeframe
Checkout The Results in Tradingview
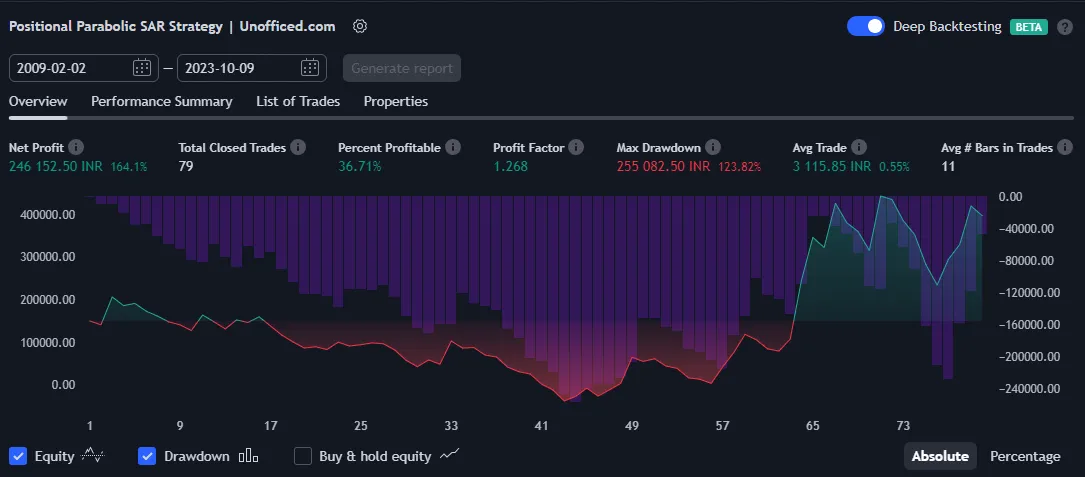
1-Month Timeframe
Checkout The Results in Tradingview
Analysis of Results
To better compare the performance, let’s summarize the key metrics from the backtests in a single table.
| Timeframe | Net Profit (%) | Profit Factor | Win Rate (%) | Number of Trades | Max Drawdown (%) |
|---|---|---|---|---|---|
| 15 Minutes | 243.61% | 1.48 | 33.72% | 344 | 20.84% |
| 30 Minutes | 260.65% | 1.58 | 36.36% | 198 | 17.65% |
| 1 Hour | 167.92% | 1.40 | 38.89% | 108 | 20.24% |
| 1 Day | 147.16% | 1.70 | 50.00% | 34 | 21.84% |
| 1 Week | 125.13% | 2.15 | 72.73% | 11 | 12.87% |
| 1 Month | 348.69% | 11.20 | 100% | 4 | 2.52% |
Several patterns emerge from this data:
- Lower vs. Higher Timeframes: As we move from lower timeframes (like 15-min) to higher ones (daily, weekly), the number of trades decreases significantly. This is expected, as trends take longer to form and reverse on higher timeframes.
- Win Rate and Profit Factor: The win rate and profit factor generally improve with higher timeframes. The weekly and monthly charts show exceptionally high metrics, but the number of trades is too low to be statistically significant. A strategy that only trades 4-11 times over several years is not a reliable system.
- The 30-Minute Sweet Spot: The 30-minute timeframe appears to offer the best balance. It produces the highest net profit among the intraday timeframes, a strong profit factor of 1.58, and a manageable drawdown. Crucially, it generates 198 trades, providing a much larger sample size than the daily or weekly charts. While the 15-minute chart is also profitable, it involves nearly twice the number of trades, which would lead to higher transaction costs (brokerage, taxes) that can erode the final return.
Conclusion and Next Steps
Our analysis demonstrates that the Parabolic SAR is a viable trend-following strategy, particularly on an index like NIFTY. The backtest on TradingView reveals that a 30-minute timeframe provides a good compromise between trade frequency, profitability, and cost-efficiency.
This lesson provides a complete framework—from mathematical theory to practical Pine Script implementation and performance analysis. Your journey does not end here. I encourage you to take this script and explore further:
- Test Other Instruments: How does the strategy perform on highly trending stocks (e.g., RELIANCE, HDFCBANK) or other indices like BANKNIFTY?
- Vary the Parameters: Experiment with different settings for the Acceleration Factor (
initial,step,cap). Does a slower or faster SAR improve results for certain instruments? - Combine with Other Indicators: In a future lesson, we will explore how combining Parabolic SAR with a trend-strength indicator like the ADX can help filter out trades during ranging markets, potentially improving the strategy’s win rate and reducing whipsaws.
Share your findings and any interesting results in the community. The path to successful algorithmic trading is paved with rigorous testing and continuous learning.