Bollinger Bands

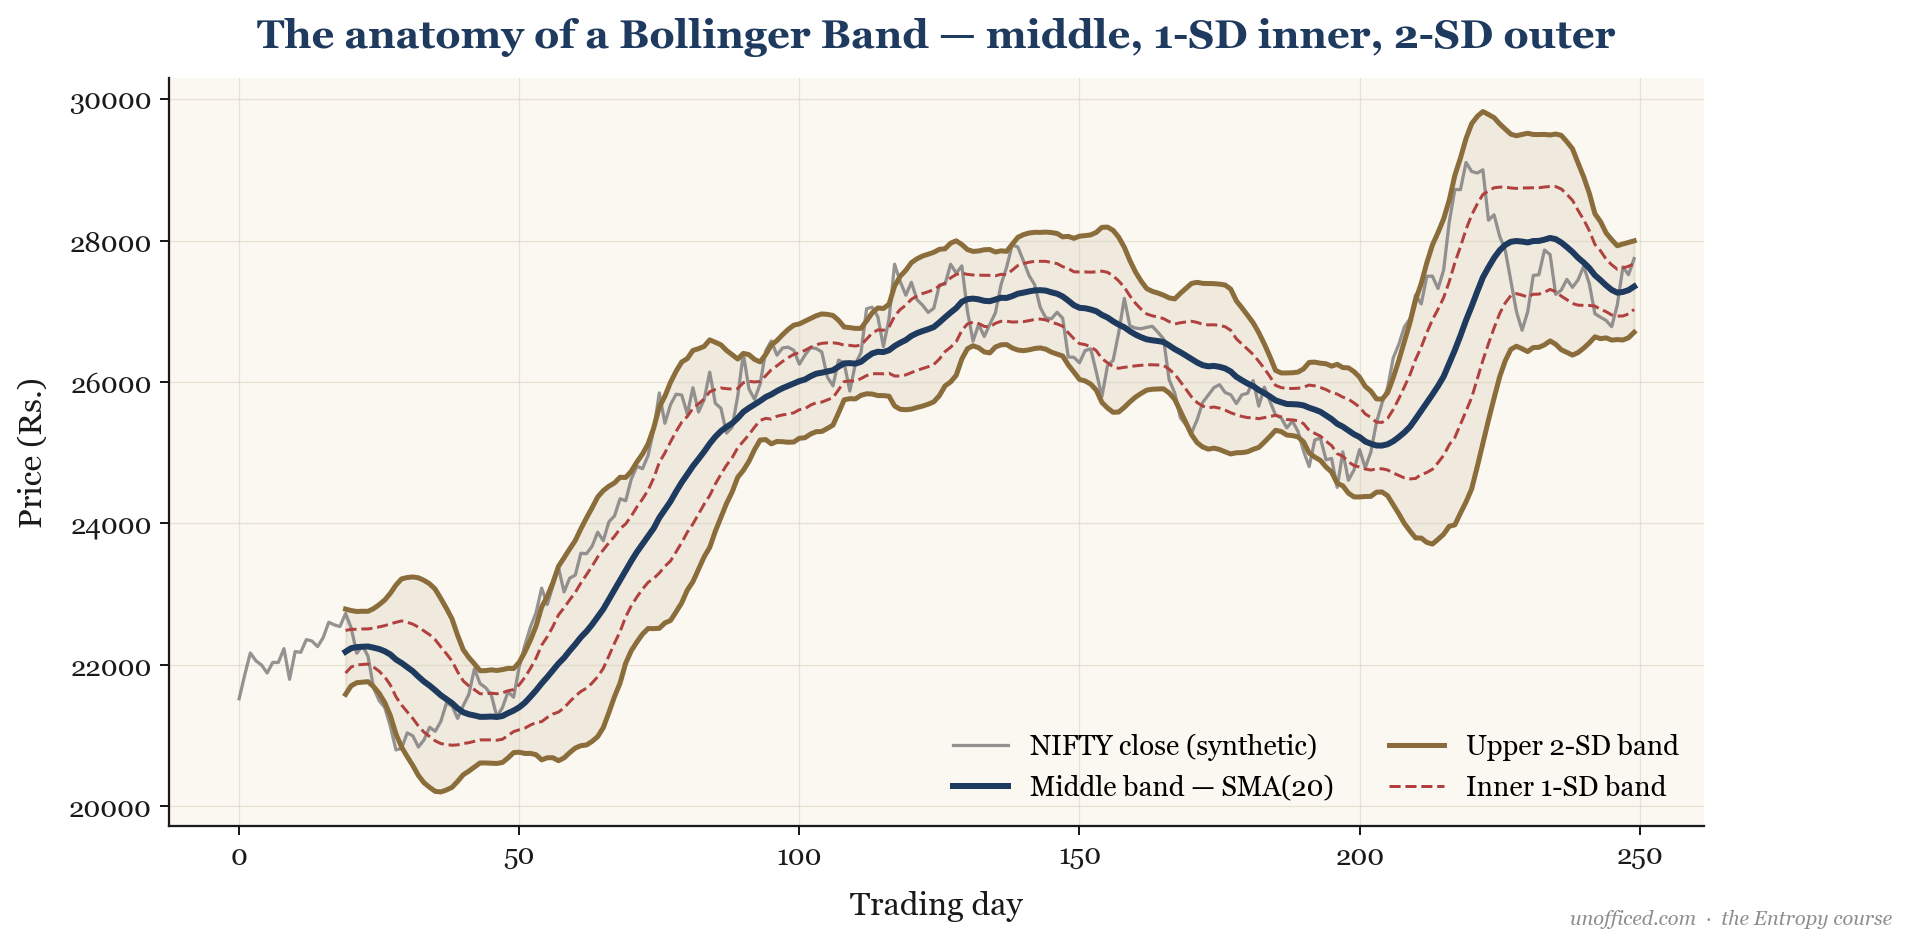
Bollinger Bands, developed by John Bollinger, are a technical analysis tool that creates a volatility envelope around a security’s price. They consist of a middle band, which is a moving average, and two outer bands set at a multiple of the rolling standard deviation above and below the middle band. For a trader, the bands provide a dynamic map of relative price highs and lows, and a measure of prevailing market volatility.
Construction and parameters
The three lines that constitute the Bollinger Bands are calculated as follows:
Middle Band (M): A moving average of the price over a specified period n.
Upper Band (U) and Lower Band (L): These are set k standard deviations above and below the middle band.
The standard parameters, as proposed by John Bollinger, are a 20-period Simple Moving Average (SMA) for the middle band (n=20) and a multiplier of 2 for the standard deviation (k=2). The rolling standard deviation, , is calculated over the same period n.
| Parameter | Default (John Bollinger) | Entropy Customisation |
|---|---|---|
| Field | Close | Close |
| Period (n) | 20 | 20 |
| Std. Dev. Multiplier (k) | 2 | 2 |
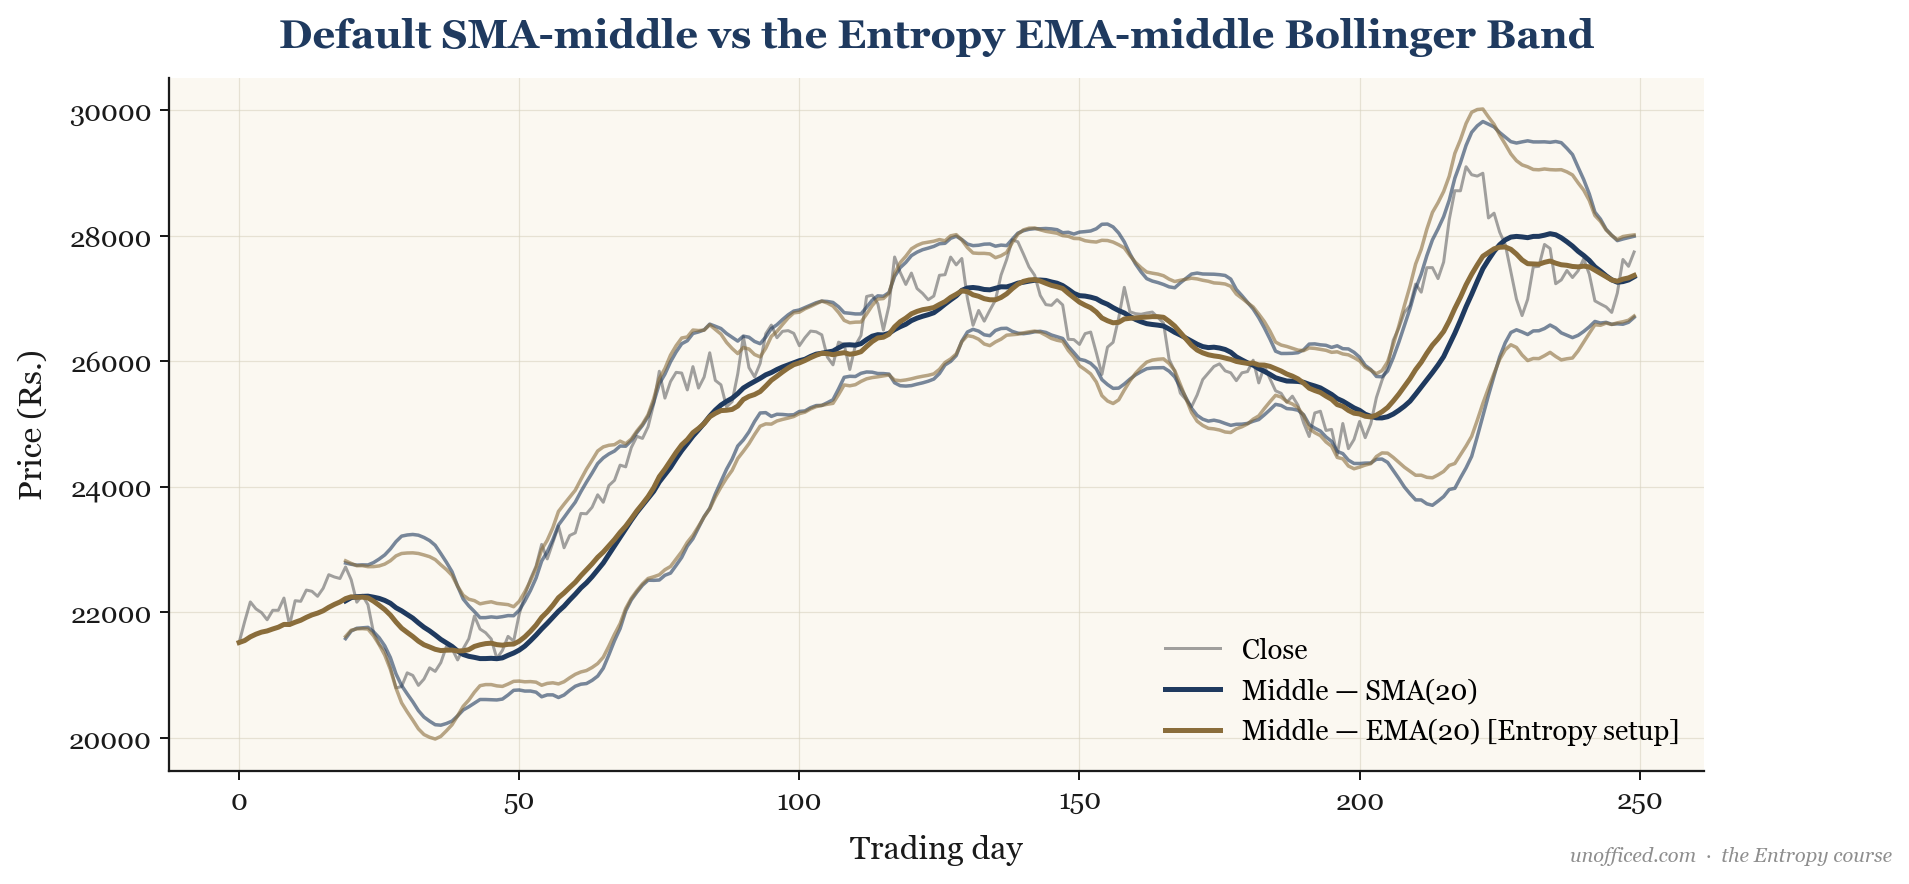
| MA Type | Simple (SMA) | Exponential (EMA) |
| Channel Fill | No | Yes |
The image below illustrates the difference. The EMA-based band (right) hugs the price action more closely than the SMA-based band (left), especially during changes in trend.
%B — where is price within the band
The %B indicator (Percent B) quantifies the relationship between price and the bands. It is an oscillator that shows where the last price is relative to the upper and lower bands.
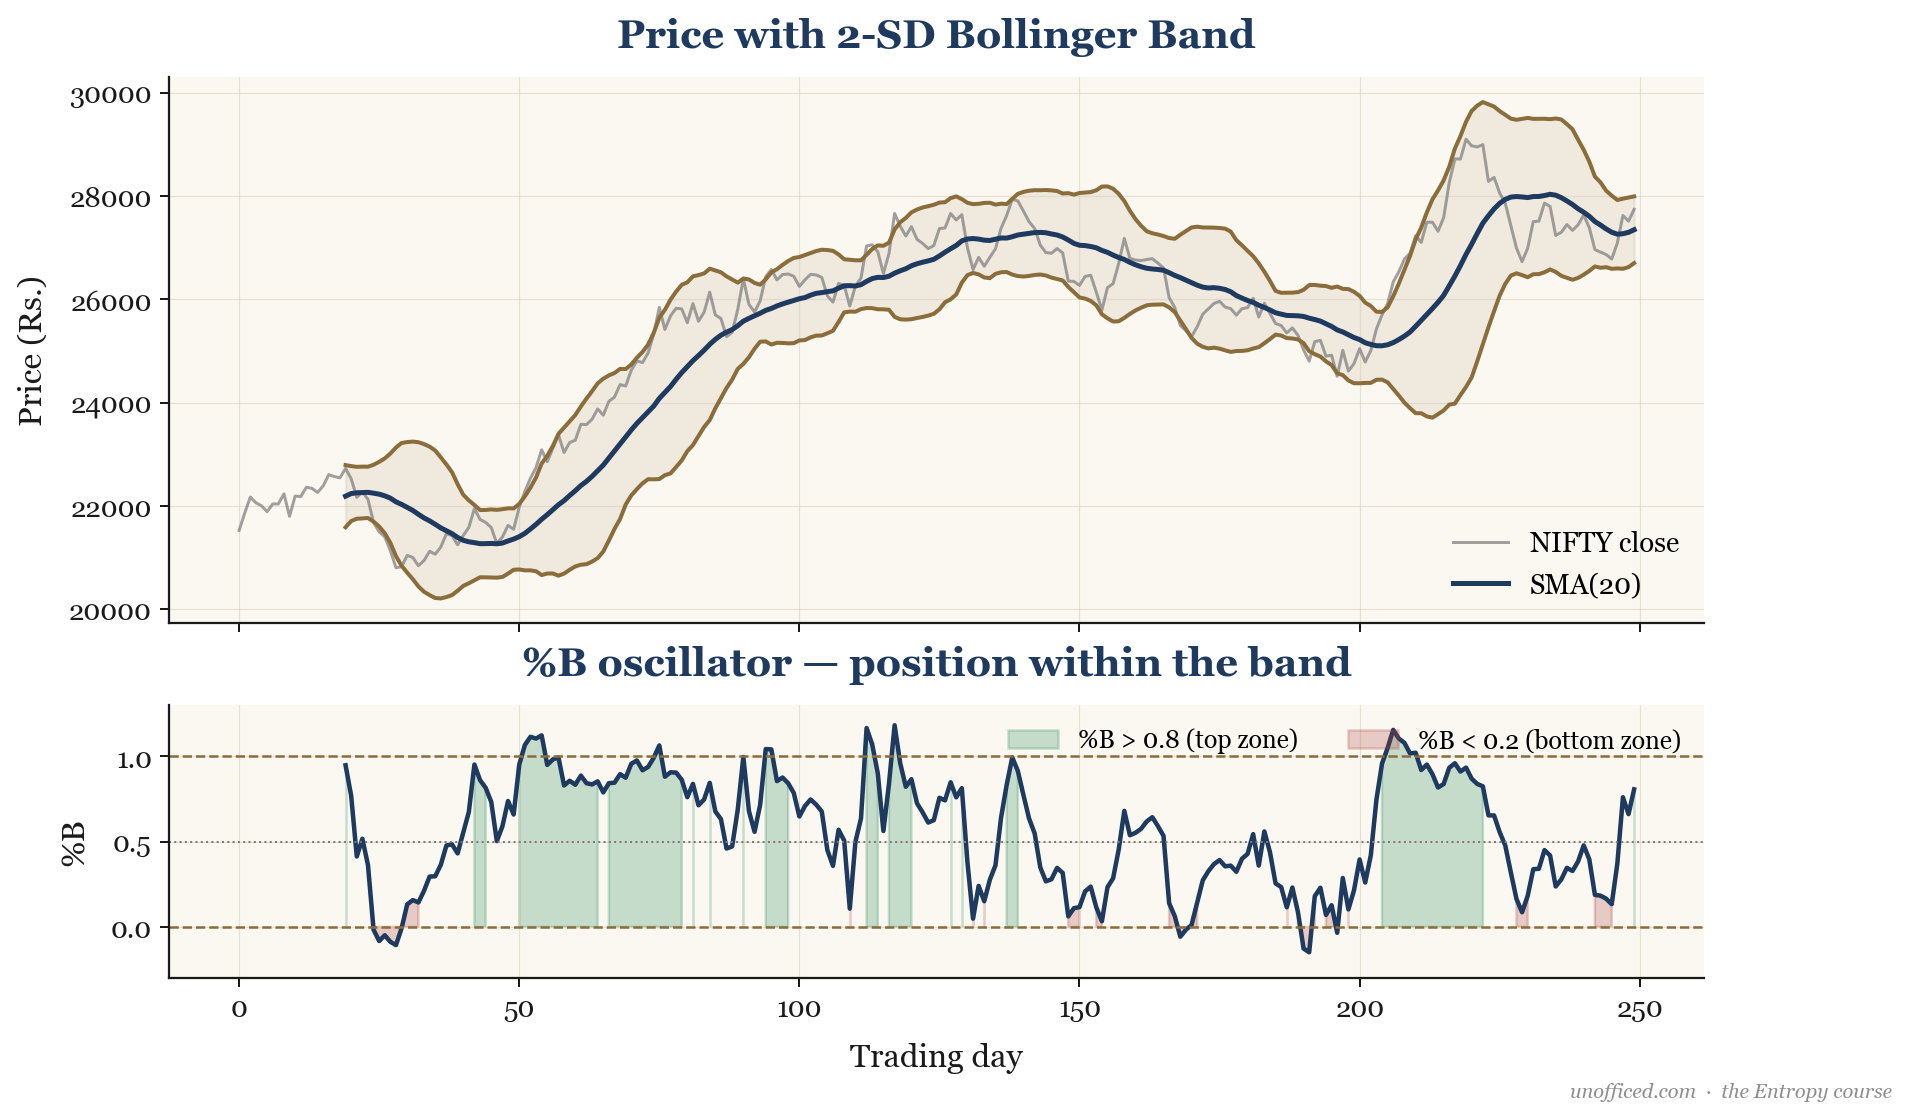
You can interpret %B values as follows:
- A %B of 0.5 means the price is at the middle band.
- A %B above 0.8 indicates the price is in the upper zone of the band, suggesting relative strength.
- A %B below 0.2 indicates the price is in the lower zone of the band, suggesting relative weakness.
- A %B above 1.0 means the price has closed above the upper band (“walking the band”).
- A %B below 0.0 means the price has closed below the lower band (“walking the band”).
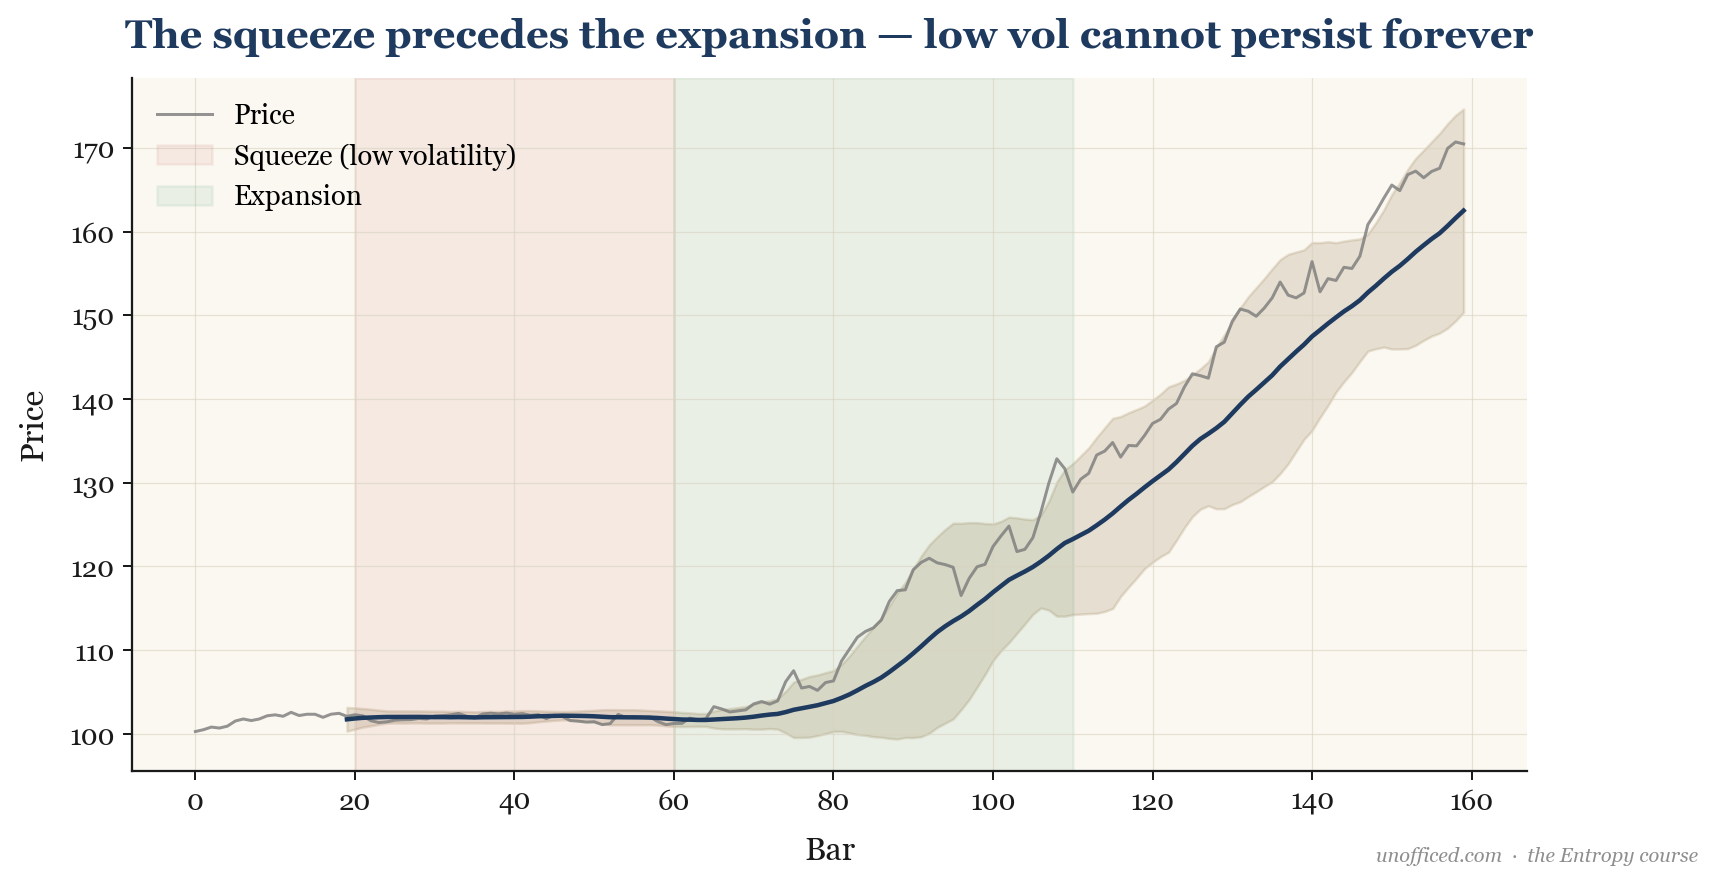
BandWidth and the squeeze
The BandWidth indicator measures the width of the Bollinger Bands relative to the middle band. It normalises the volatility measurement, allowing for comparisons across different securities and timeframes.
A key pattern derived from BandWidth is the “squeeze”.
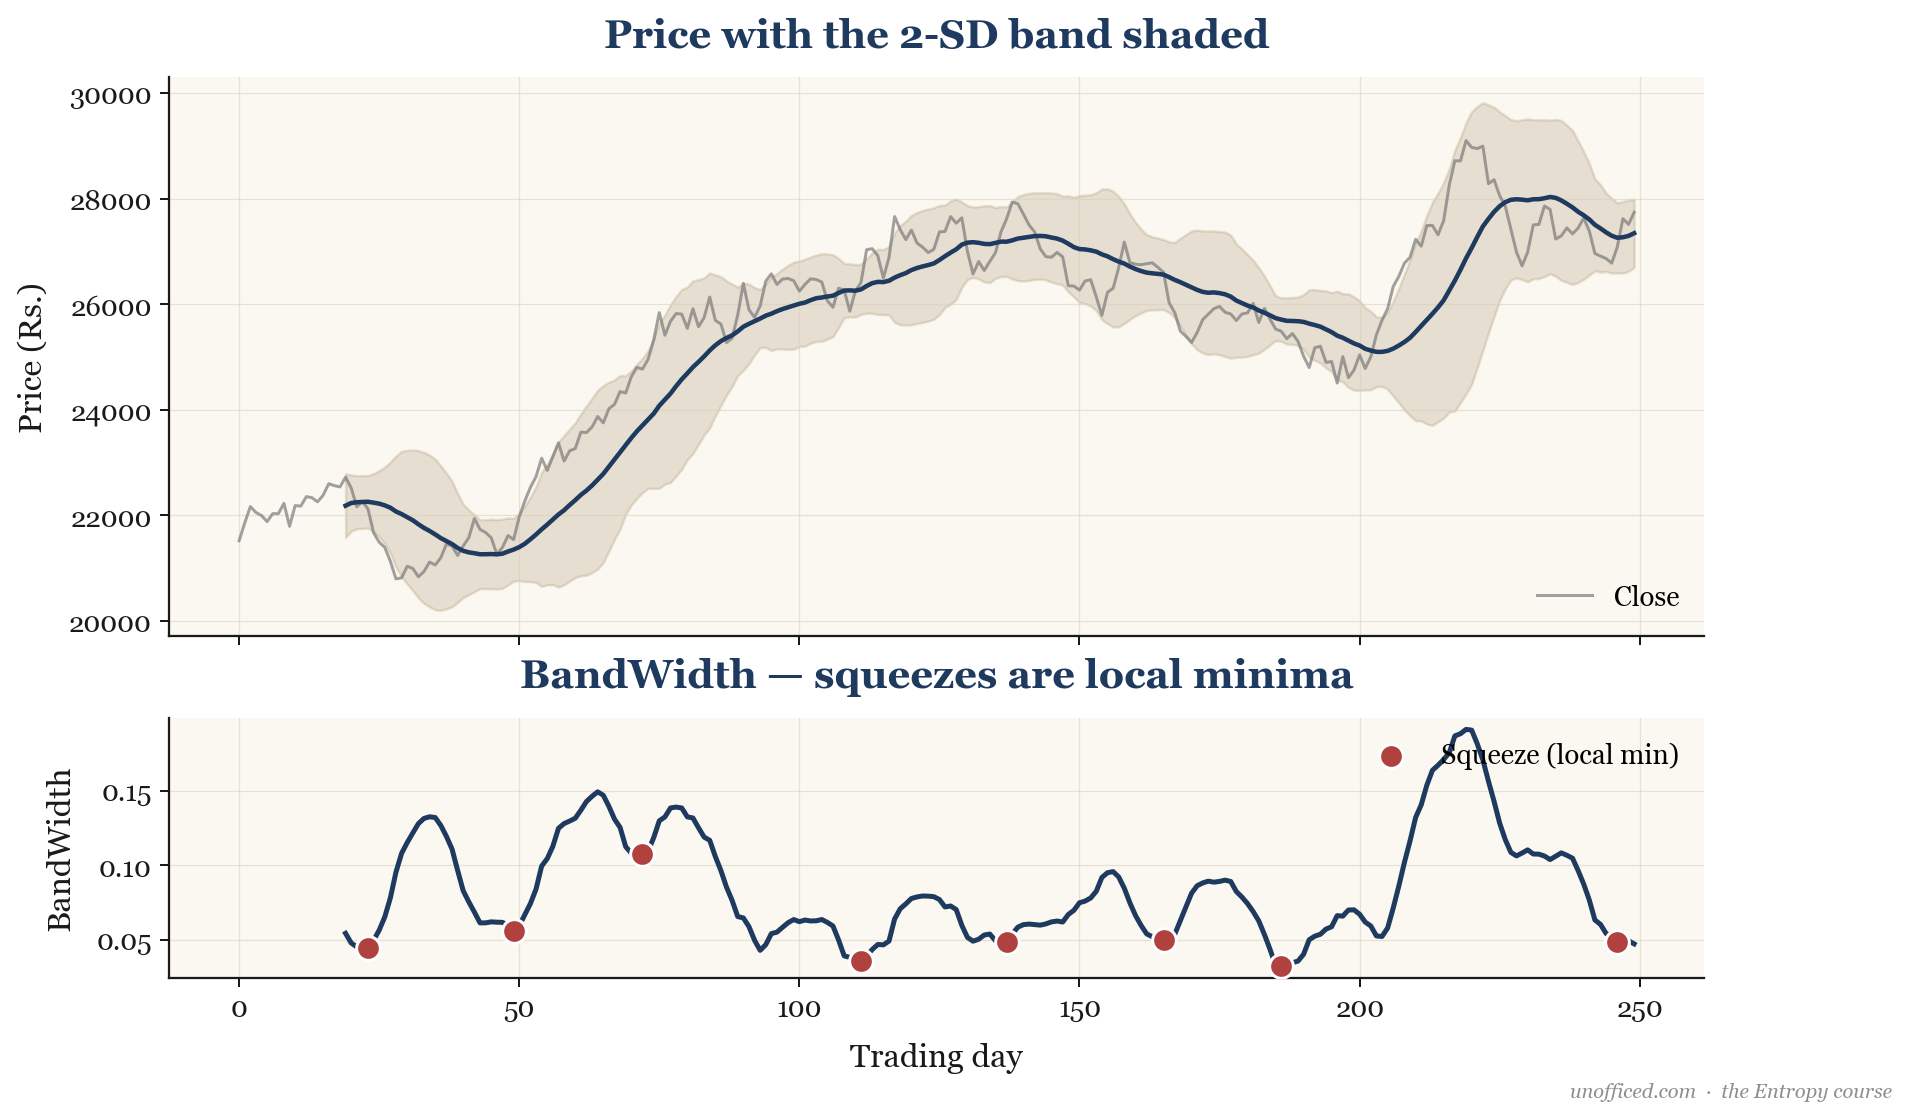
Traders look for a squeeze to identify periods of consolidation that may resolve in a strong directional breakout or breakdown.
Reading the band — three legitimate uses
While often misinterpreted as simple overbought/oversold signals, the primary uses of Bollinger Bands are more nuanced.
- Volatility Envelope: The bands provide a dynamic frame of reference for price action. They widen during volatile periods (e.g., after earnings announcements or news events) and contract during quiet periods.
- Mean Reversion Bias: Price has a statistical tendency to revert to its mean. When price reaches an extreme at the upper or lower band, it signals a potential move back towards the middle band. This is not a guaranteed reversal but a higher probability setup, especially in range-bound markets.
- Walking the Band: In a strong, established trend, prices can “walk the band” by repeatedly touching or slightly exceeding the upper band (in an uptrend) or the lower band (in a downtrend). This is a sign of trend strength and momentum, and attempting to fade (trade against) this move is a common and costly mistake.
Summary
This lesson provides a foundational understanding of Bollinger Bands and their components. The key takeaways are:
- Bollinger Bands adapt to market volatility, widening when volatility is high and narrowing when it is low.
- The standard settings are a 20-period SMA and bands set at 2 standard deviations, but we customise this with an EMA for faster response.
- The %B indicator quantifies where the current price is in relation to the bands on a scale, typically between 0 and 1.
- The BandWidth indicator measures the width of the bands, allowing traders to spot a “squeeze,” which often precedes a significant price move.
- The bands provide a framework for assessing volatility, mean-reversion setups, and trend strength—not just simple reversal signals.
In the next lesson, we will see how to refine these concepts into a concrete trading signal using the %B indicator.