Combining Parabolic SAR with ADX

The Parabolic SAR is a powerful tool for identifying trend direction and potential reversals. However, like any trend-following indicator, its primary weakness is a choppy, sideways, or non-trending market. In such conditions, the SAR can generate numerous false signals, or “whipsaws,” leading to small, frustrating losses that quickly accumulate.
To mitigate this, we must pair the Parabolic SAR with an indicator that measures trend *strength*. The SAR tells us the *direction* of the trend; we need a complementary tool to tell us if that trend is strong enough to be worth trading. One of the most effective and widely-used indicators for this purpose is the Average Directional Index (ADX).
Understanding the Average Directional Index (ADX)
The ADX, developed by J. Welles Wilder Jr. (who also created the RSI and Parabolic SAR), is a trend strength indicator. It does not provide any information about the trend’s direction, only its momentum. The ADX is plotted as a single line with values ranging from 0 to 100.
The interpretation is straightforward:
- ADX below 20-25: Indicates a weak trend or a ranging market. In this zone, trend-following systems like the Parabolic SAR are unreliable.
- ADX rising above 25: Suggests the emergence of a strong trend (either up or down). This is the “green light” for a trend-following strategy.
- ADX between 25 and 50: A healthy, trending market.
- ADX above 50: A very strong, mature trend. While this confirms momentum, extremely high readings can sometimes precede trend exhaustion, so caution is advised.
The core idea is to use the ADX as a filter. We only consider Parabolic SAR signals when the ADX confirms that a tradable trend is in place.
The Strategy: Combining Parabolic SAR and ADX
The rules for combining these two indicators are logical and designed to keep traders on the right side of momentum.
Rules for a Long Trade
- Filter: The ADX must be greater than 25. This confirms the market has sufficient trend strength.
- Entry Signal: The Parabolic SAR flips from being above the price to below the price. This signals the start of a potential uptrend.
- Action: Enter a long position on the candle following the SAR flip. The initial stop-loss is the first SAR dot below the price.
Rules for a Short Trade
- Filter: The ADX must be greater than 25.
- Entry Signal: The Parabolic SAR flips from being below the price to above the price. This signals the start of a potential downtrend.
- Action: Enter a short position on the candle following the SAR flip. The initial stop-loss is the first SAR dot above the price.
The exit for both long and short trades is primarily managed by the Parabolic SAR itself, which acts as a dynamic trailing stop-loss. A trade is closed when the SAR flips to the opposite side of the price.
Visual Analysis: SAR and ADX in Action
Let’s examine how this filter works on a real chart.
Scenario 1: Weak Trend (ADX < 25)
The chart below shows a period where the market is largely directionless. Notice the ADX line at the bottom is consistently below the 25 level.

Analysis:
- ADX Below 25: The low ADX reading correctly identifies this as a non-trending, sideways market.
- SAR Whipsaws: The Parabolic SAR, used in isolation, generates multiple buy and sell signals in quick succession. Each of these would have likely resulted in a small loss or a break-even trade.
Scenario 2: Strong Trend (ADX > 25)
Now, contrast the previous example with the chart below. Here, the ADX has crossed and remains above the 25 level, indicating a strong uptrend has begun.
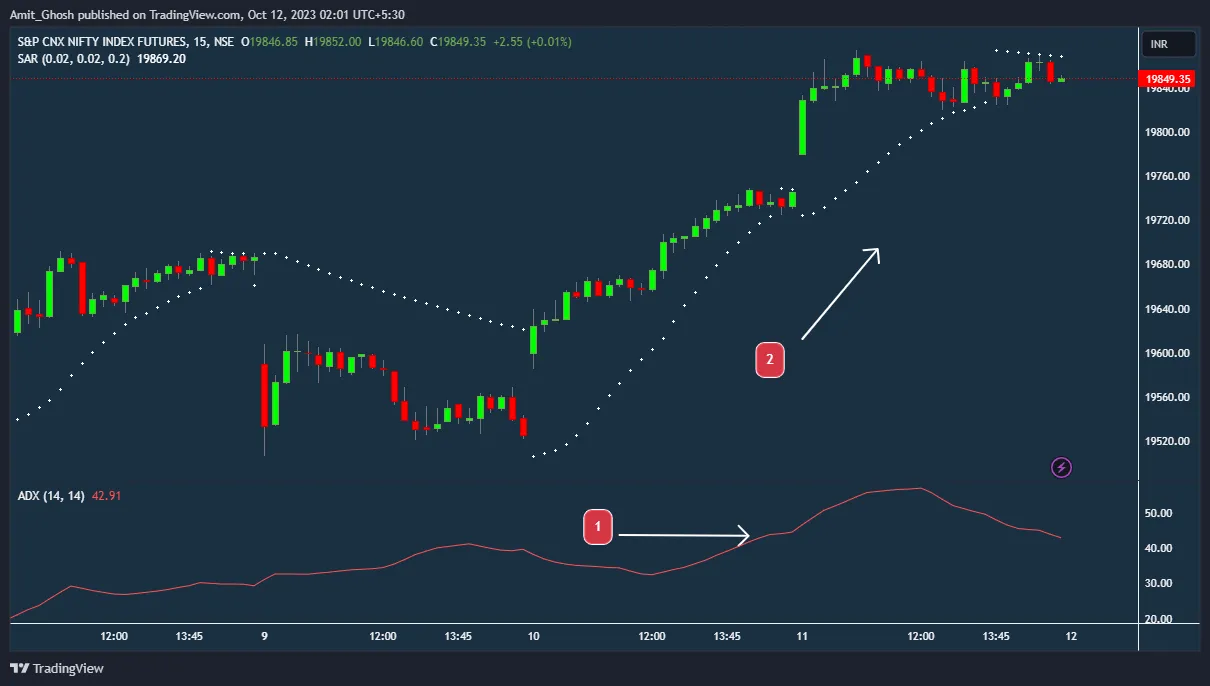
Analysis:
- ADX Above 25: The rising ADX confirms that momentum is strong and the market is in a tradable trend.
- Clean SAR Signal: When the Parabolic SAR flips to below the price, it provides a high-probability entry signal. The ADX filter gives us the confidence to take this trade. The SAR then acts as an excellent trailing stop-loss, allowing the position to capture a significant portion of the uptrend.
This combination effectively turns the Parabolic SAR from a simple trend indicator into a complete trading system: the ADX provides the “when” (market condition) and the SAR provides the “where” (entry point and exit management).
Adjusting Indicator Settings
Both Parabolic SAR and ADX come with default settings that can be fine-tuned.
Parabolic SAR Settings
The standard settings are:
- Start: 0.02
- Increment (Acceleration Factor): 0.02
- Max Value: 0.20
The formula for the SAR is iterative:
Where:
- is the next period’s SAR value.
- is the current SAR value.
- is the acceleration factor (the “Increment”).
- is the Extreme Point (the highest high in an uptrend or lowest low in a downtrend).
Making the SAR more sensitive (smaller numbers for Start and Increment) will bring the dots closer to the price, leading to more signals but also more whipsaws. Making it less sensitive (larger numbers) will place the dots further from the price, resulting in fewer signals that are generally more reliable, but potentially slower to react to reversals.
ADX Settings
The default setting for the ADX is a 14-period lookback. This is the standard for most timeframes and instruments. Shorter periods will make the ADX more responsive but choppier, while longer periods will make it smoother but slower to react.
Summary of the Strategy
By combining the Parabolic SAR with the ADX, we create a robust trend-following system.
- The Parabolic SAR identifies the trend direction and provides entry signals and a trailing stop-loss mechanism.
- The ADX acts as a powerful filter, measuring the strength of the trend and giving us a clear condition for when to act on SAR signals.
- The Golden Rule: Only take Parabolic SAR signals when the ADX is above 25. Ignore all signals when the ADX is below 25.
- This combination helps traders avoid choppy markets, reducing the number of false signals and improving the overall quality and profitability of the trades taken.
- While default settings (SAR: 0.02, 0.02, 0.20; ADX: 14) are a good starting point, traders should test and optimize these parameters for their specific instruments and timeframes.
This disciplined approach transforms the Parabolic SAR from a standalone indicator into a core component of a complete trading methodology, enhancing its effectiveness and protecting capital during unfavourable market conditions.