Indicator

A technical indicator is a mathematical transformation of an asset’s price or volume data. It is a statistical tool designed to surface specific information, like trend, momentum, or volatility, that a trader can use to analyse market conditions and make trading decisions. Indicators are not a crystal ball; they are simply a lens through which to view price action. Most indicators fall into one of three recognisable families.
The three families of indicators
Technical indicators can be broadly classified into three categories based on what they measure.
1. Trend Indicators
These indicators help identify the direction and strength of a market trend. They are typically overlaid on the price chart itself.
- Simple, Exponential, and Double Exponential Moving Averages (SMA, EMA, DEMA)
- Moving Average Convergence Divergence (MACD)
- Bollinger Bands (BB)
- Parabolic SAR (PSAR)
2. Momentum Indicators (Oscillators)
These indicators measure the speed and magnitude of price changes, helping to identify overbought or oversold conditions. They are usually plotted in a separate pane below the price chart and “oscillate” between defined levels.
- Relative Strength Index (RSI)
- Stochastic Oscillator
- Money Flow Index (MFI)
- Commodity Channel Index (CCI)
- Rate of Change (ROC)
3. Volume Indicators
These indicators use volume to measure the conviction behind a price move. Strong volume can confirm a trend, while weak volume may suggest a lack of conviction.
- Volume Histogram
- On-Balance Volume (OBV)
- Accumulation/Distribution Line (A/D)
- Volume-Weighted Average Price (VWAP)
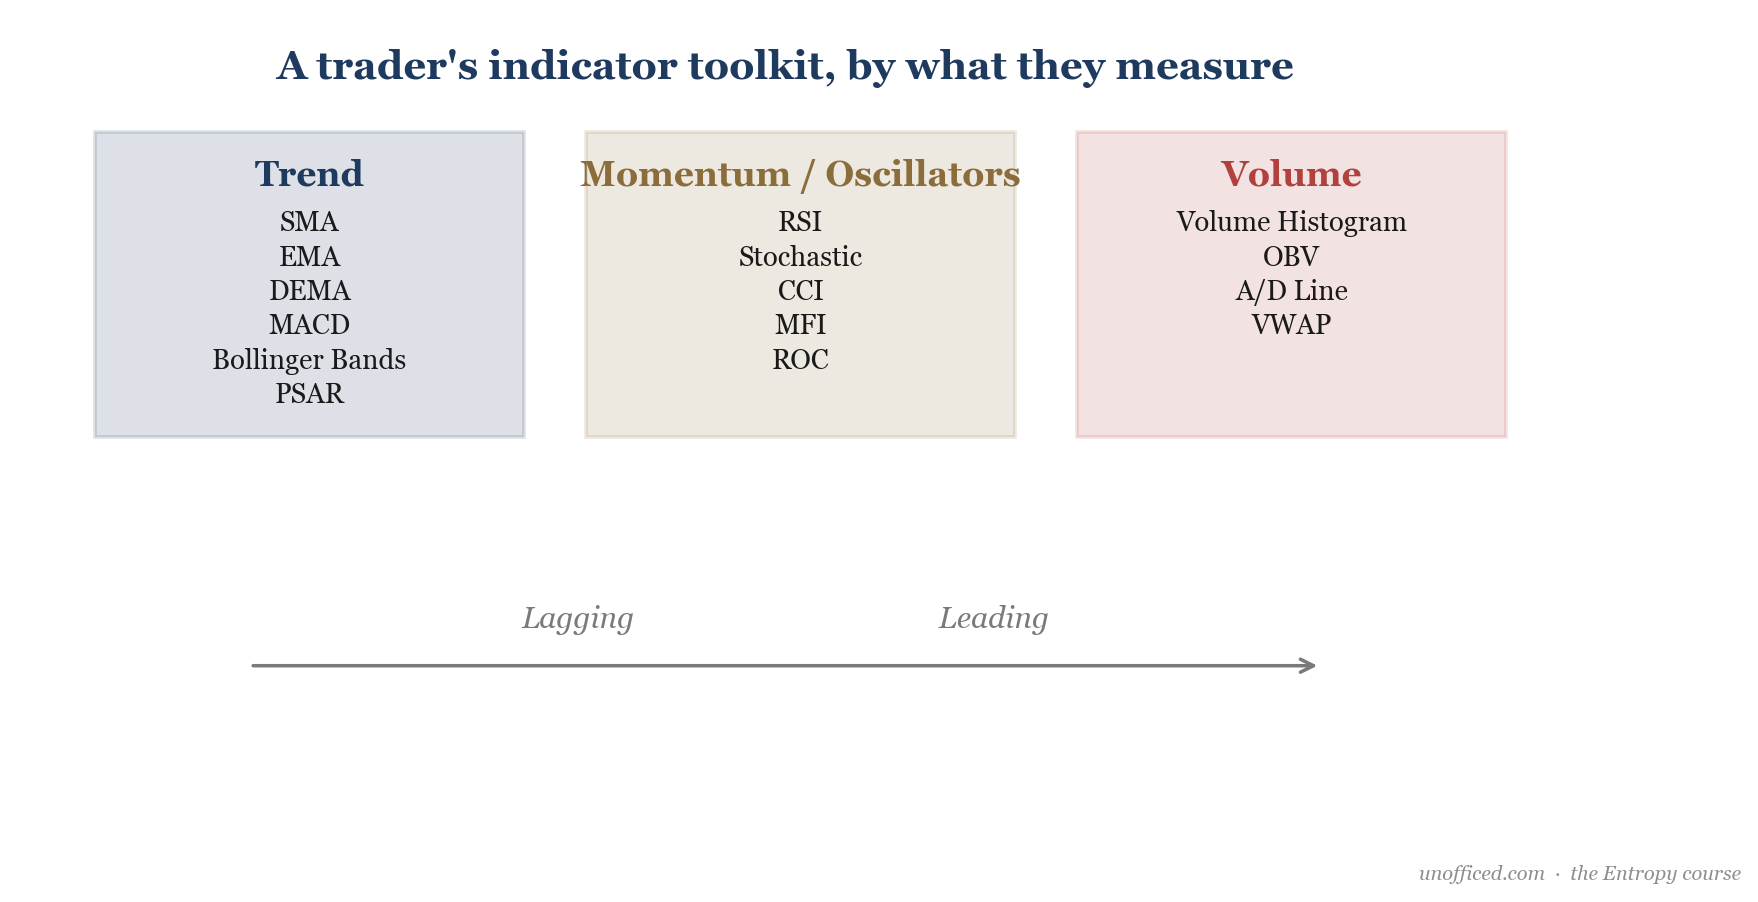
Lagging vs. Leading Indicators
Beyond these families, indicators are also classified by whether they signal after or before a price move has occurred.
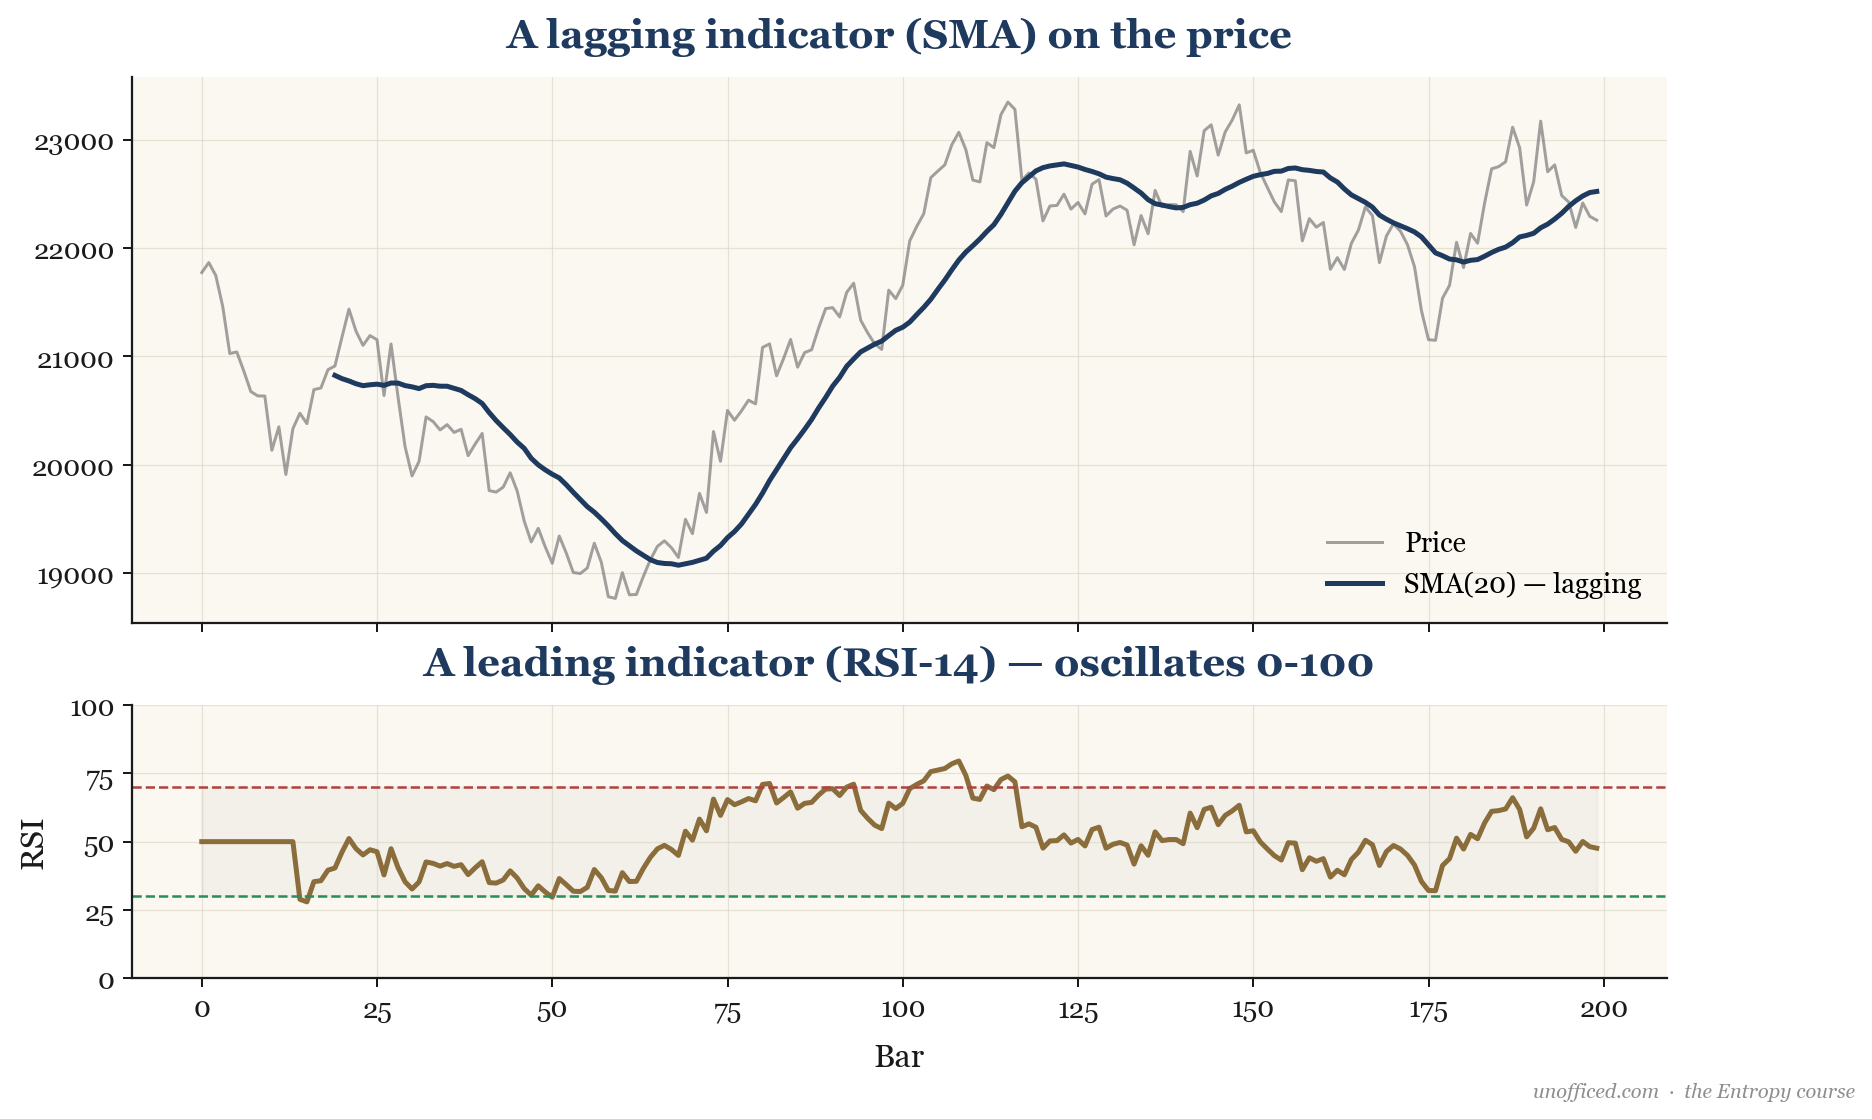
A lagging indicator is one that follows the price action. It gives a signal *after* the price move has already started. Most trend-following indicators like Moving Averages, MACD, and Bollinger Bands fall into this category. They confirm a trend once it is established.
A leading indicator is one that tries to anticipate future price moves. Oscillators like RSI, Stochastics, and MFI are considered leading because they can signal overbought or oversold conditions that might precede a price reversal.
What This Course Uses
The Entropy framework is built on a specific combination of indicators chosen for their complementary nature:
- Bollinger Bands: A trend and volatility indicator that forms the core of the system.
- Stochastic (Smoothed): A momentum oscillator to gauge overbought/oversold levels.
- Money Flow Index (MFI): A volume-weighted oscillator that acts as a secondary confirmation.
- Volume Histogram: To provide context on the conviction behind price moves.
A later refinement in this course collapses the signals from the Stochastic and MFI oscillators into a single, powerful %B oscillator, which simplifies the chart while retaining the necessary information.
Choosing Indicator Periods
The “period” or “lookback” is a critical parameter for any indicator. It defines how much historical data is used in its calculation. While there is no single “correct” setting, certain standards have emerged over time.
- Momentum Oscillators (RSI, Stochastics): 14 periods is a common default.
- Moving Averages & Bollinger Bands: 20 periods is widely used for short-to-medium term analysis.
- MACD: The standard setting is (12, 26, 9) — representing the fast EMA, slow EMA, and signal line SMA, respectively.
Summary
This chapter introduced the foundational concepts of technical indicators.
- Indicators are mathematical calculations based on price and volume.
- They are generally grouped into trend, momentum, and volume families.
- Lagging indicators confirm moves after they happen; leading indicators try to predict them.
- No indicator is perfect. A robust trading system combines complementary indicators.
- The choice of indicator period is critical and must align with the trader’s chosen timeframe.
The simplest and most fundamental indicator is the moving average. It forms the backbone of many other indicators, including the Bollinger Bands, which we will dissect in the next chapter.