Indicator
- What indicators are
- The difference between trending and ranging indicators
- The difference between lagging and leading indicators
- How you can combine indicators to make trading decisions
- And what you should take into account when combining indicators
Indicators
- Indicators are tools that help you make the market conditions clearer.
- They can confirm whether a market is trending or ranging.
- Or whether an asset is overbought or oversold And therefore signal that a reversal may be due.
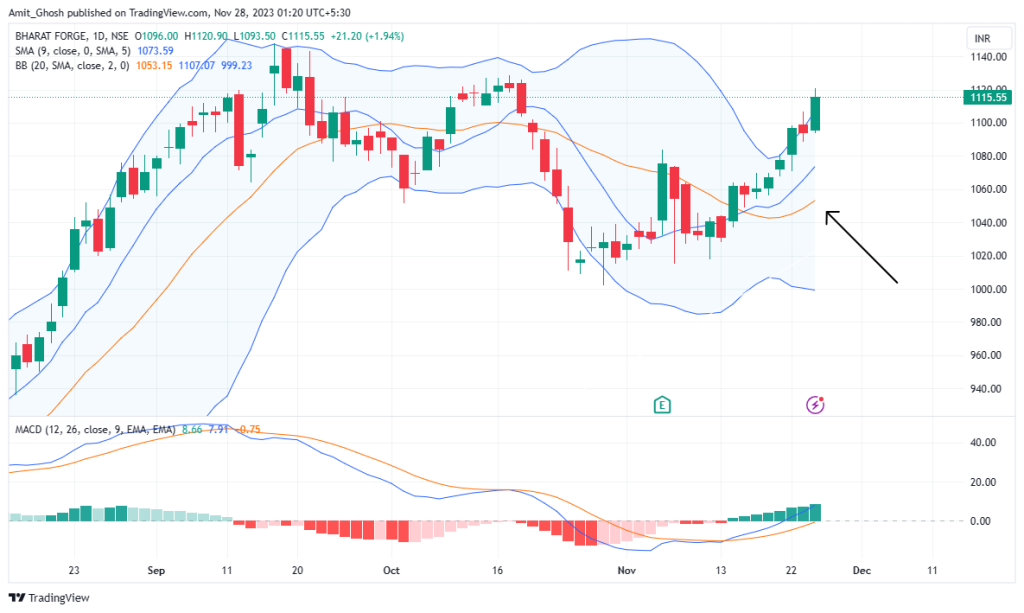
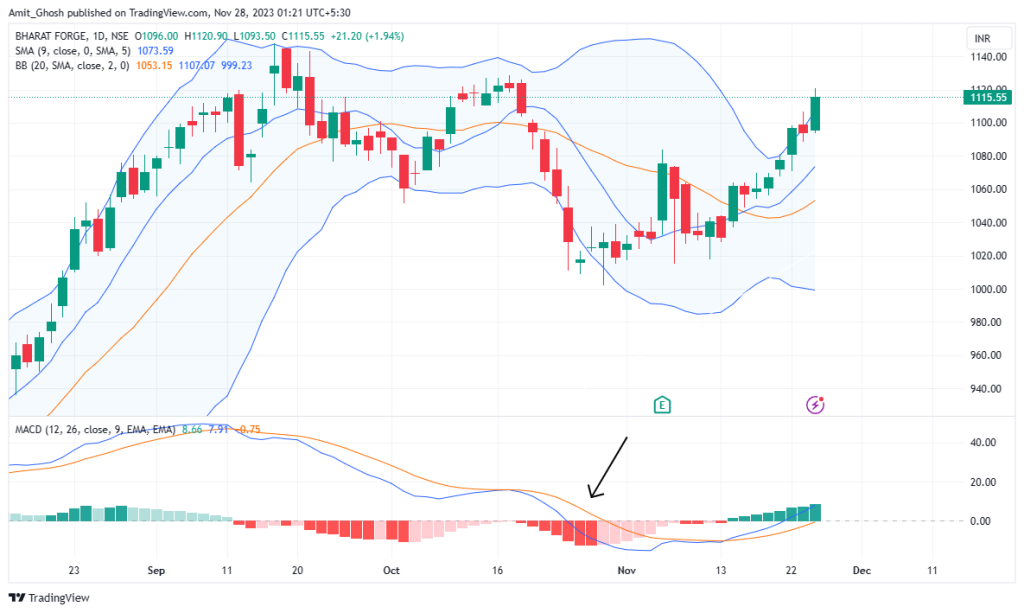
Types of Indicators
Indicators can be categorized into two main types:
- Trending.
- Ranging.
Trending Indicators
Trending indicators help identify if the market is experiencing a trend and the direction of that trend.
One of the most commonly used trending indicators is the moving average. Using a moving average as an example, You can identify the trend by looking at the slope of the moving average and whether the price is above or below it.
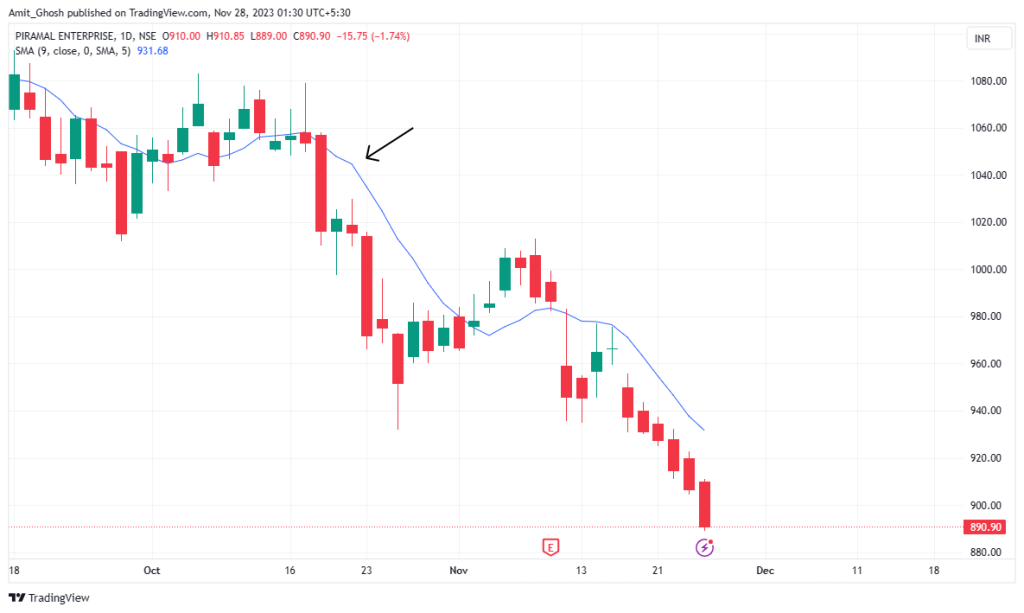
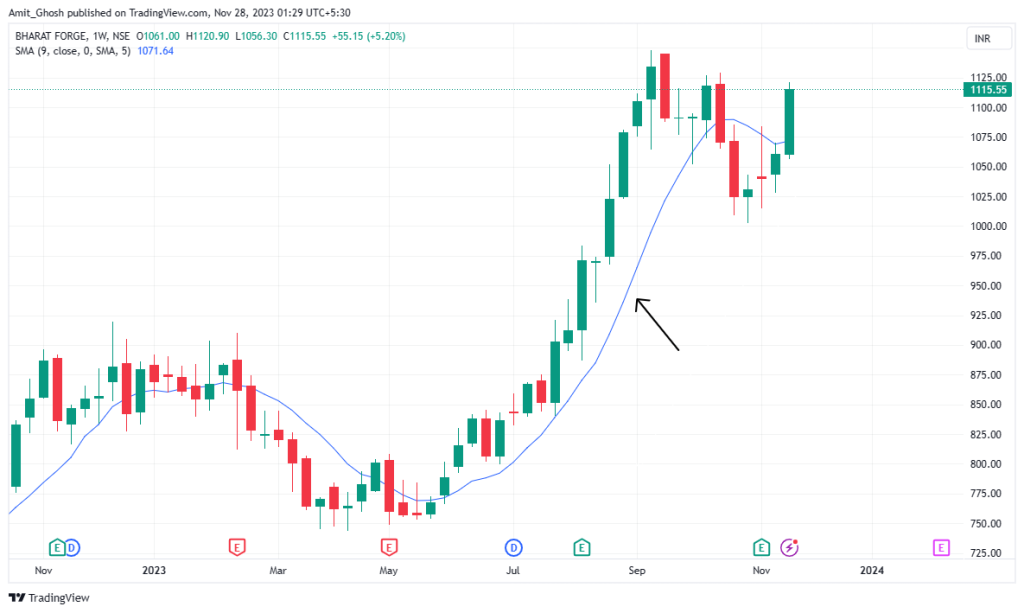
Ranging Indicators
The other type of indicator is the ranging indicator.
- They work best in a range-bound market.
- They provide signals to buy or sell when the price reaches the lower or upper boundary of the range respectively.
Ranging indicators are also known as oscillating indicators because they oscillate between an upper level and a lower level.
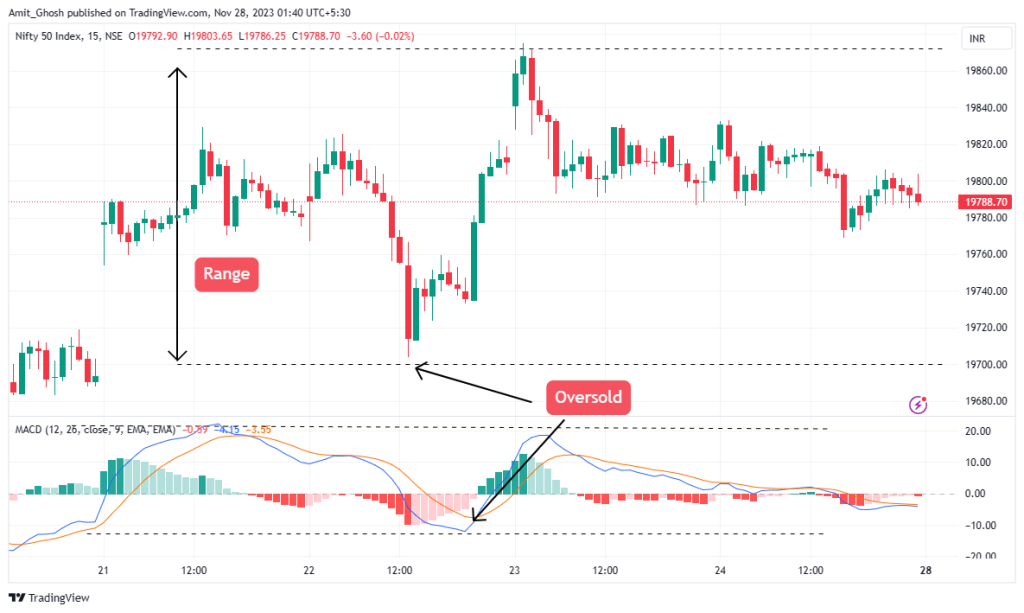
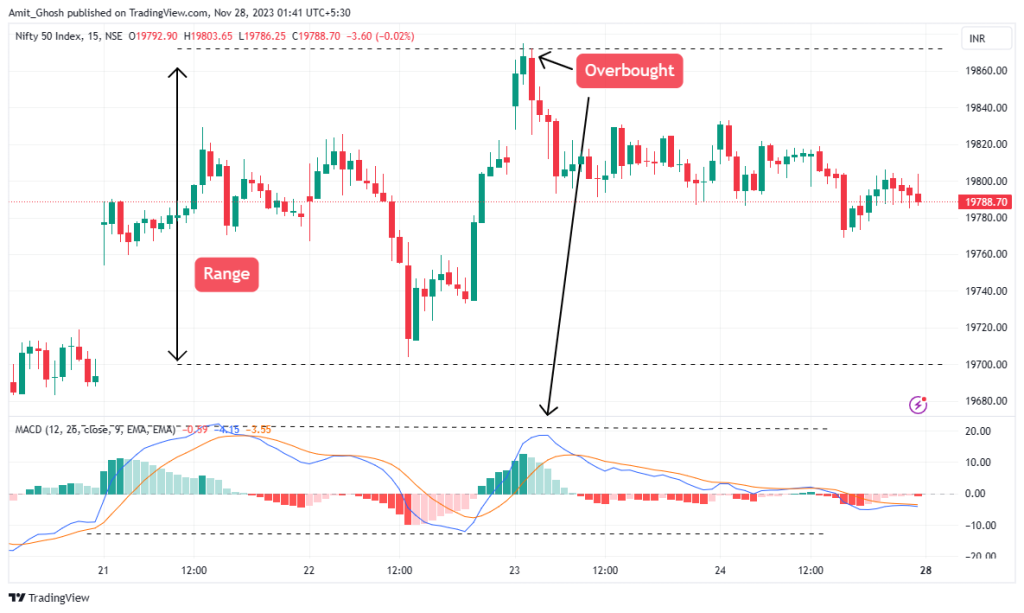
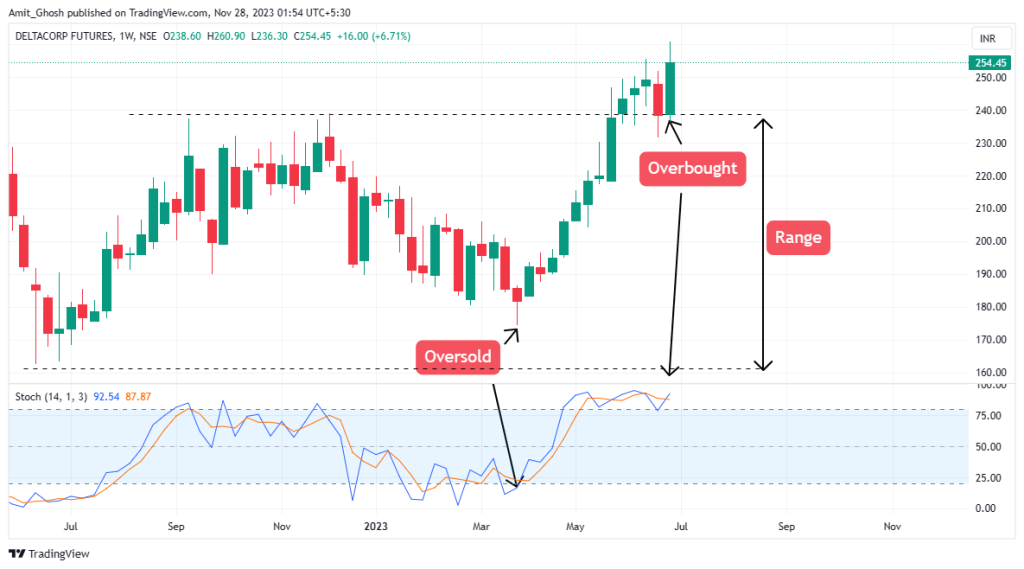
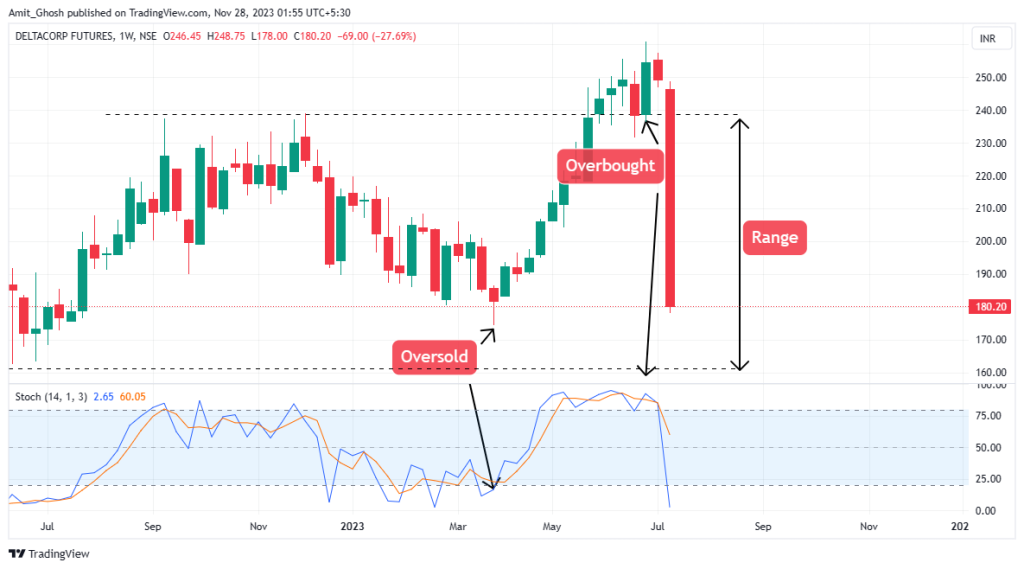
When the upper level is reached, It indicates that the asset is overbought and that the price may move back down into the range.
When the upper level is reached, It indicates that the asset is overbought and that the price may move back down into the range. This example uses the MACD indicator which is an oscillator that shows overbought and oversold conditions in a ranging market.
Categories of Indicators
- Lagging indicators and
- leading indicators
Lagging Indicators
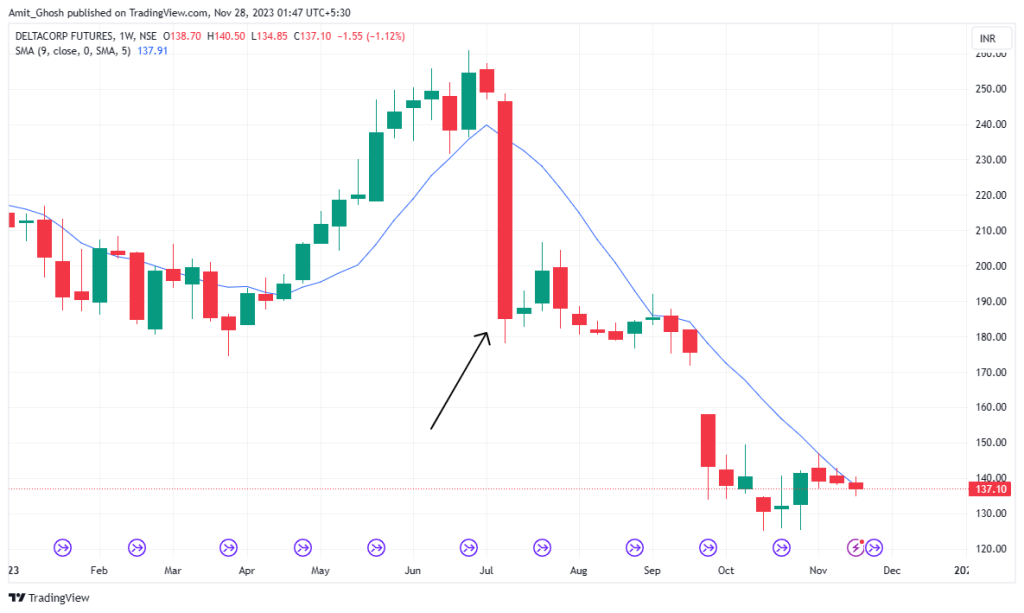
If an indicator is lagging, it means that it provide information about the price action after it has happened.
Trading indicators are usually classed as lagging indicators because they will confirm whether the price is trending after it has started.
Leading Indicators
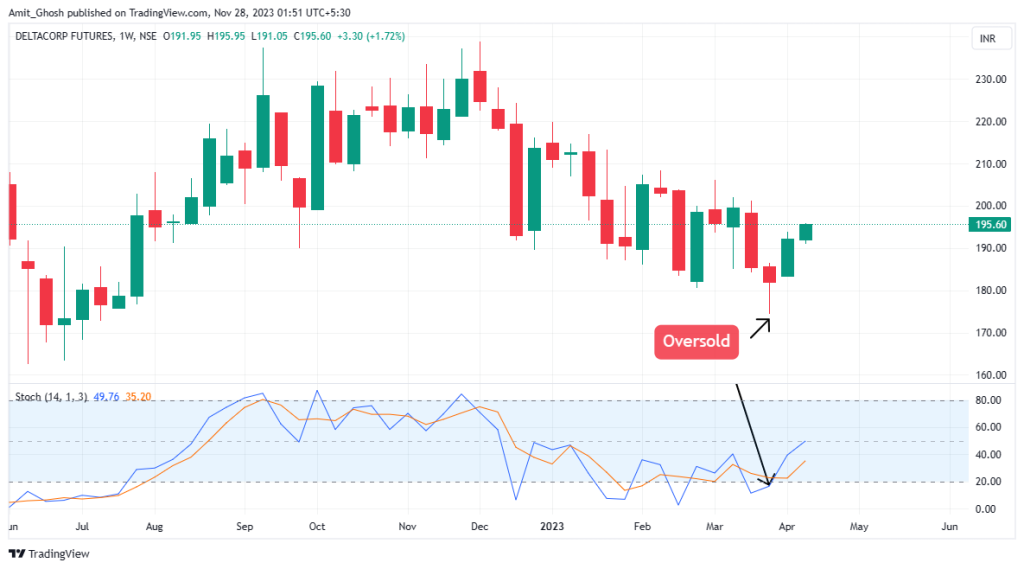
A leading indicator will generally indicate signals ahead of time.
For this reason, ranging indicators or so-called oscillators will generally fall into this category because they indicate when the price is due for a reversal.
Combining Market Indicators
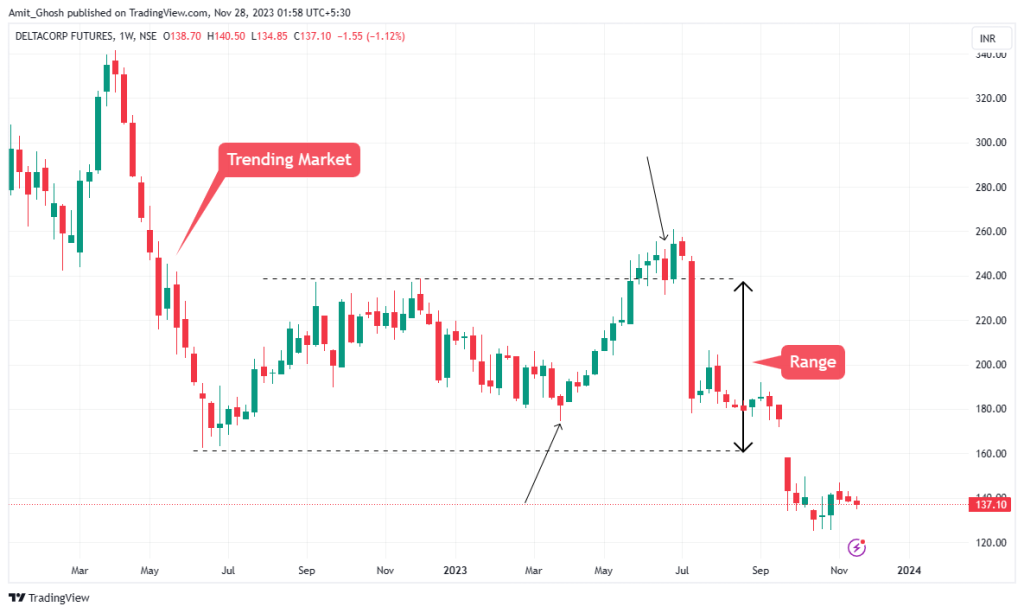
Because the market conditions change, Some indicators are more useful than others and can be combined depending on the market environment.
The market could be ranging for a while but the sentiment can change and the market could start trending. You can display different indicators so you can be ready to trade in any market condition, then you can use one or the other to determine when to enter and exit the market.
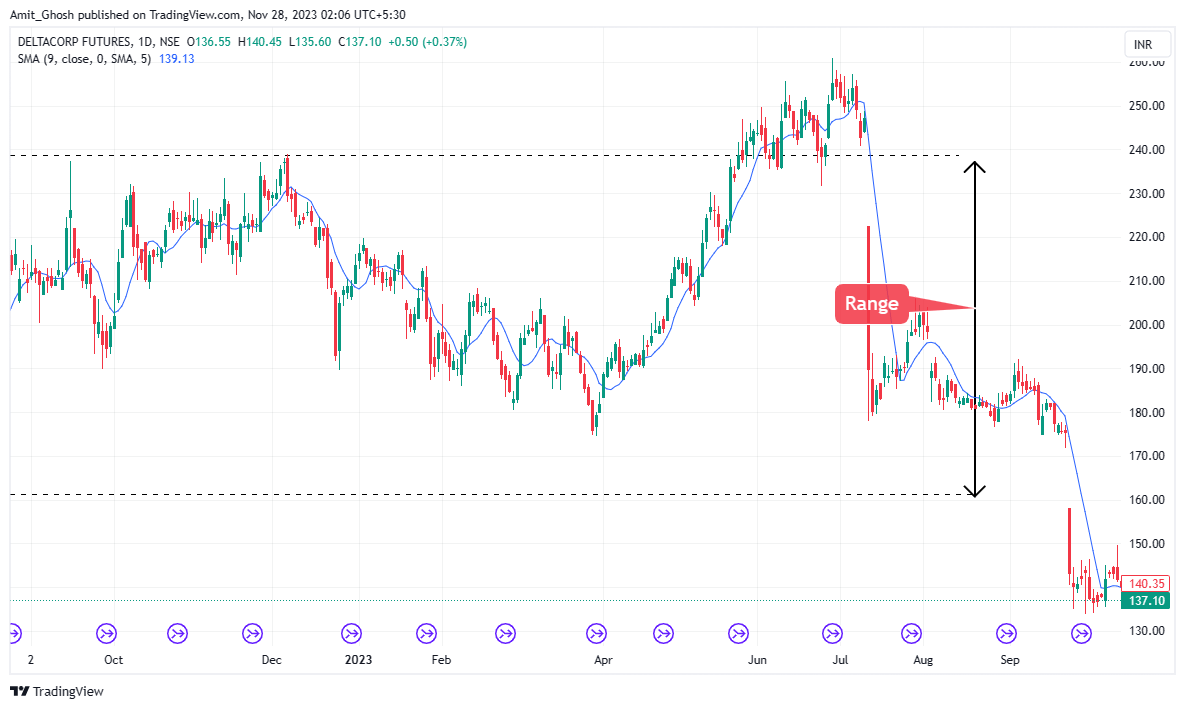
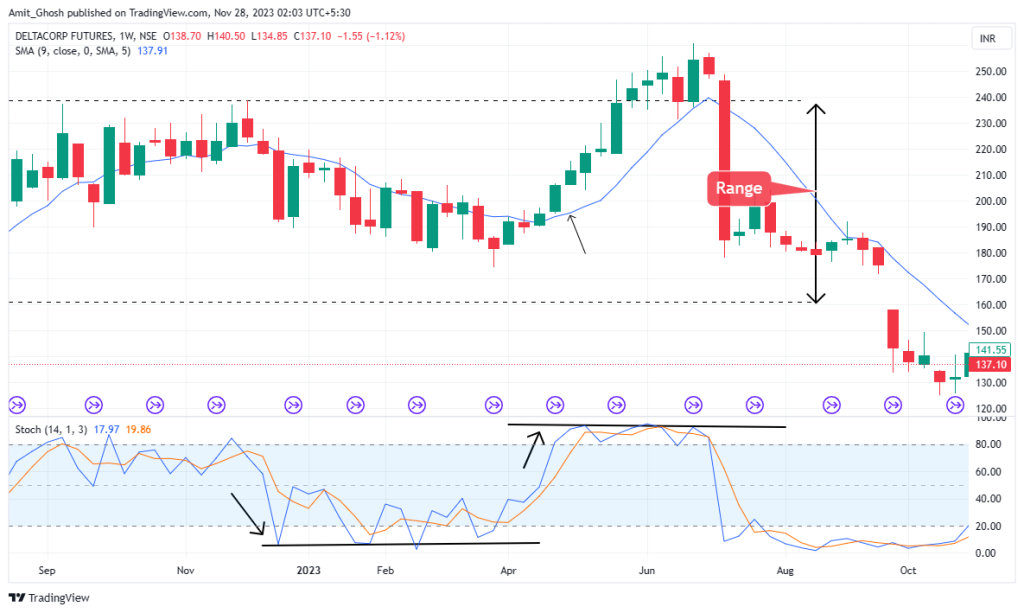
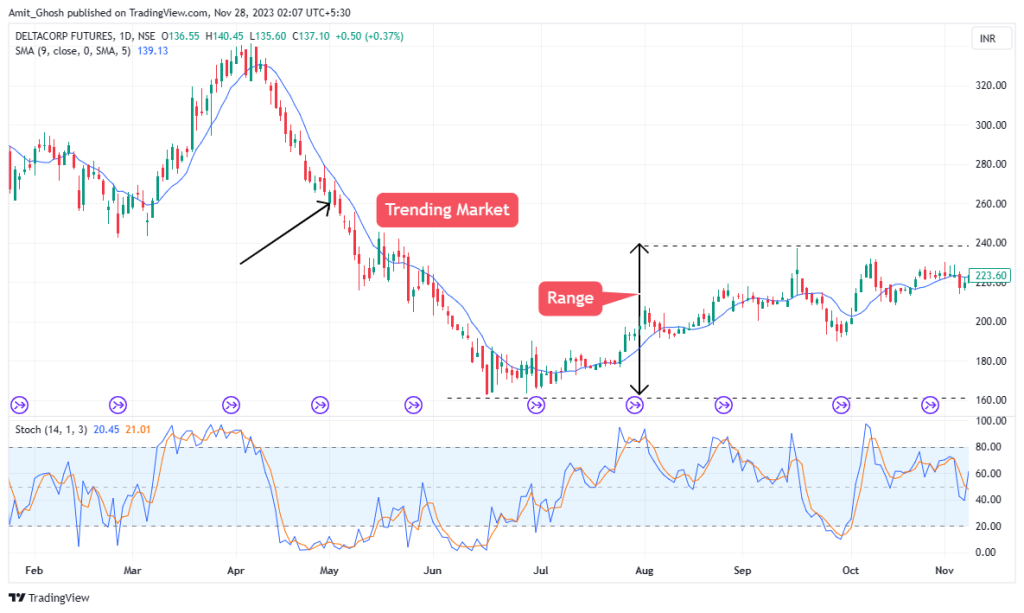
It is when the market sentiment changes and the market starts trending that the stochastic oscillator becomes less useful. And, then, The moving average provides more reliable information to the trader.
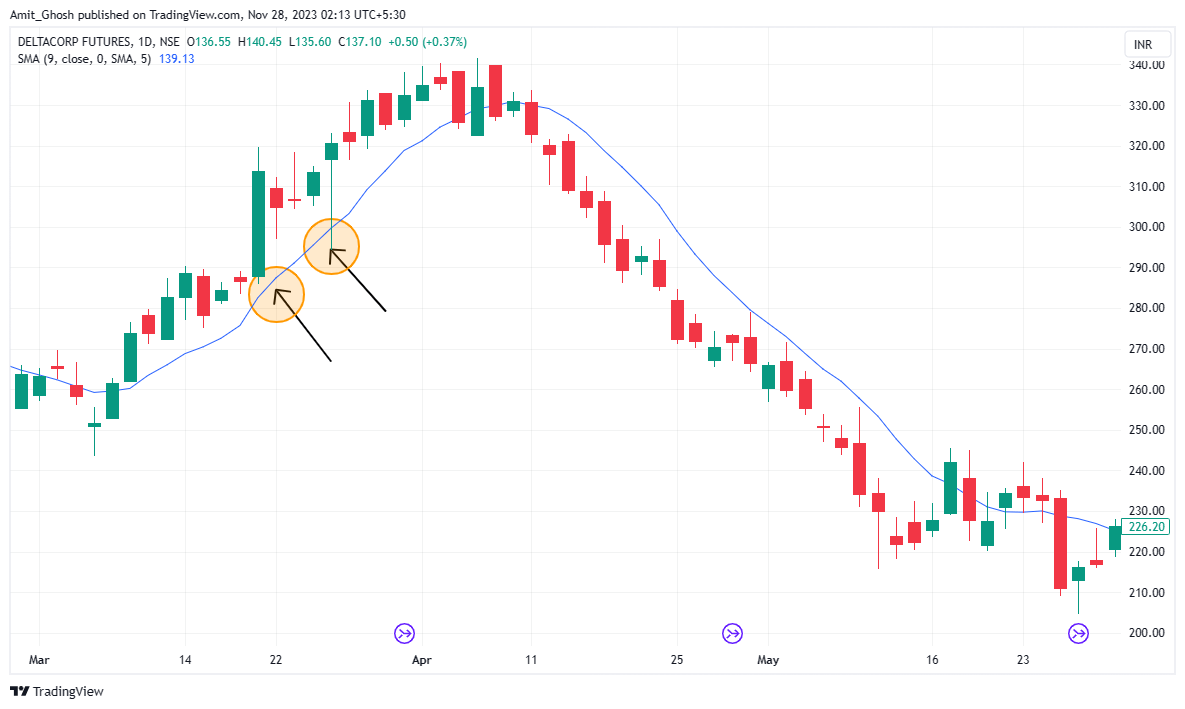
Firstly, the moving average will help you to confirm the direction of the market.
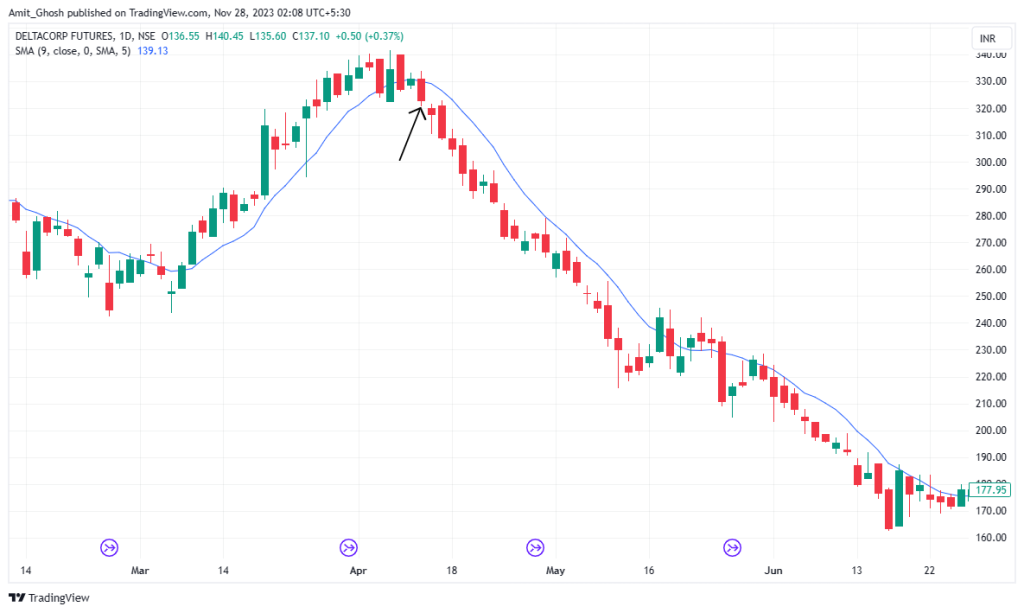
The price moves away from the moving average and the moving average begins to point down. The price moves below the moving average and confirms the market is now in a downtrend.
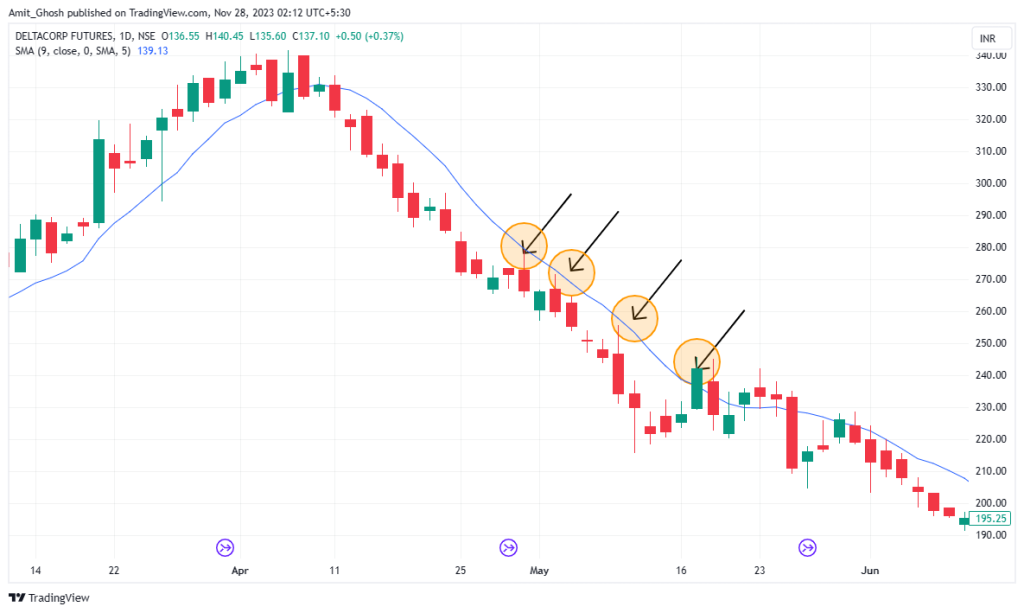
You can then use the moving average to help make trading decisions.
Overload
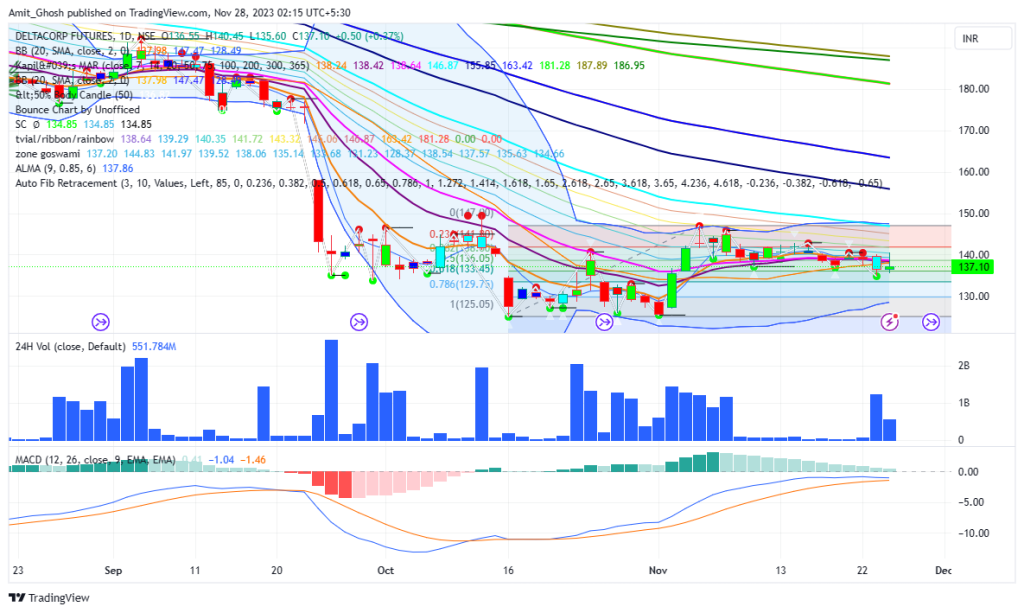
- It is advised that you do not plot too many indicators on your charts.
- They do not provide any more useful information and can give conflicting signals.
- Also, using too many indicators directly on the price chart can obscure price action.
- It is best to stick to a few indicators that can be used in different market conditions
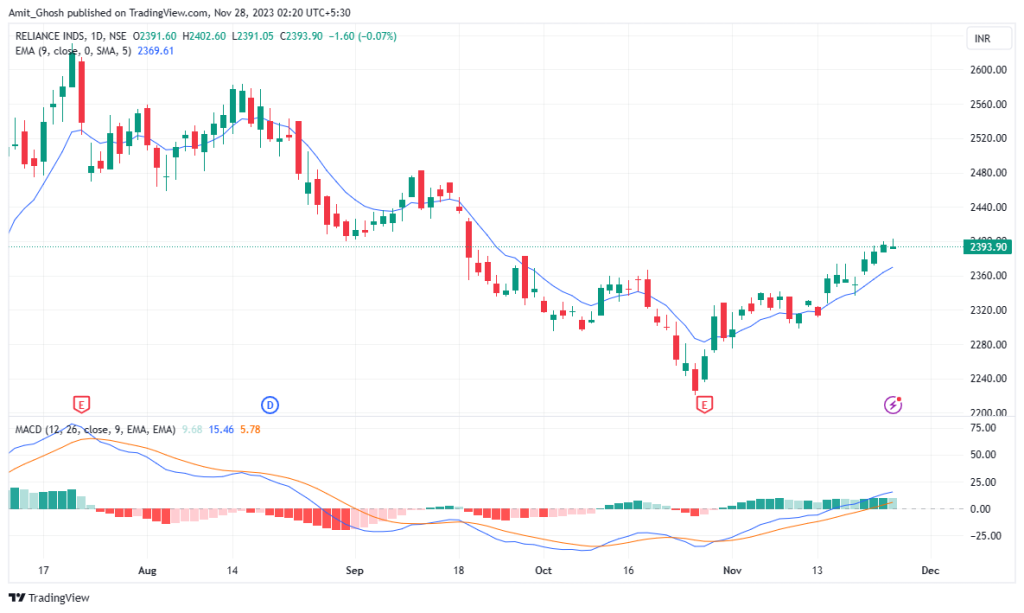
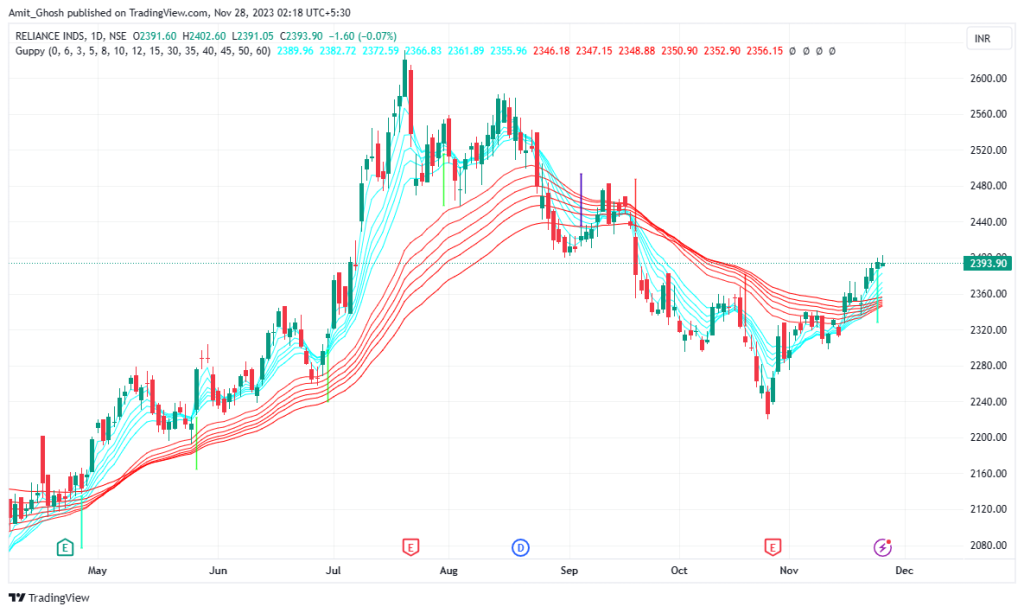
Note, though, that there is less restriction when placing more than one indicator on the chart. You can, for instance, use multiple moving averages at the same time. It only becomes restrictive when the amount of indicators used starts obscuring price action.
There are other indicators that can be used for different market conditions. You will learn how to use them in the next chapters.
Conclusion
- Indicators are tools that a trader plots on or beneath the price chart.
- They provide clarity about the current market conditions and generate or confirm trading signals.
- Indicators can be divided into trending and ranging categories.
- Ranging indicators oscillate between two extremes and work best during range-bound markets.
- Trending indicators work best during trending markets.
- You also learned that indicators can be divided into two further groups called lagging and leading indicators.
- Leading indicators can give signals ahead of price action confirmation
- Whereas lagging indicators are used to confirm what price has already been done.
- Too many indicators of the same type underneath your chart will not provide more useful information and can actually provide conflicting signals
- Also, too many indicators plotted directly on your price chart can obscure price action.

