Backtesting Parabolic SAR Strategy in Multiple Instruments

In the previous lesson, we backtested the Parabolic SAR strategy on NIFTY Futures and observed its behaviour. Now, we will expand our analysis to other instruments to test the strategy’s robustness. A strategy’s true worth is revealed not in its performance on a single, ideal instrument, but in its adaptability across different market structures and asset classes.
We will test the default Parabolic SAR settings (start=0.02, increment=0.02, max=0.20) on two distinct types of stocks:
- Reliance Industries: A large-cap, index-heavyweight stock.
- Vedanta: A cyclical, commodity-based stock.
This comparison will help us understand the market conditions where Parabolic SAR is most and least effective.
The Mathematics of Parabolic SAR
Before diving into the backtests, let’s revisit the core mechanics of the Parabolic SAR. SAR stands for “Stop And Reverse.” It’s a trailing stop that tracks the price, accelerating towards it as the trend progresses. The core idea is that time is the enemy of a profitable trade; if a position isn’t making new gains, the stop should tighten to protect profits.
The formula for the Parabolic SAR is iterative. For an uptrend, the SAR for the next period is calculated as:
Where:
- is the SAR value for the current period.
- is the Extreme Point – the highest high price recorded since the current uptrend began.
- is the Acceleration Factor. It starts at a predefined value (typically 0.02) and increases by a step (also 0.02) each time a new EP is achieved, up to a maximum value (typically 0.20).
For a downtrend, the logic is inverted: the SAR is placed above the price, and the EP becomes the lowest low recorded during the trend.
A Worked Numerical Example
Let’s calculate the SAR for a synthetic NIFTY uptrend.
Parameters: Initial , Step = 0.02, Max .
Assume the trend has just turned up. The initial SAR is typically set to the lowest low of the previous trend. Let’s say the prior low was 17,000. The initial EP is the high of the candle that confirmed the reversal. Let’s say that was 17,200.
| Day | High | Low | Prior SAR | Prior EP | Prior α | Calculation | New SAR |
|---|---|---|---|---|---|---|---|
| 1 | 17,300 | 17,250 | 17,000 | 17,200 | 0.02 | 17,004 | |
| 2 | 17,450 | 17,280 | 17,004 | 17,300 | 0.04 | 17,015.84 | |
| 3 | 17,400 | 17,350 | 17,015.84 | 17,450 | 0.06 | 17,041.89 |
Walkthrough:
- Day 1: The SAR for Day 1 is calculated using the prior period’s values. It comes to 17,004. This is below the low of Day 1 (17,250), so the trend continues. Since Day 1’s high (17,300) is a new EP, we increase α to 0.04 for the next calculation.
- Day 2: The SAR is now 17,015.84. Still below the low of Day 2 (17,280). We made a new high at 17,450, so this becomes our new EP, and we increase α again to 0.06.
- Day 3: The SAR tightens to 17,041.89. The low of Day 3 is 17,350. The trend is still intact. However, we did not make a new high. Therefore, the EP remains 17,450 and α remains 0.06 for the next day’s calculation.
The process continues until the SAR value for a given day is higher than that day’s low, which triggers a “Stop and Reverse” signal.
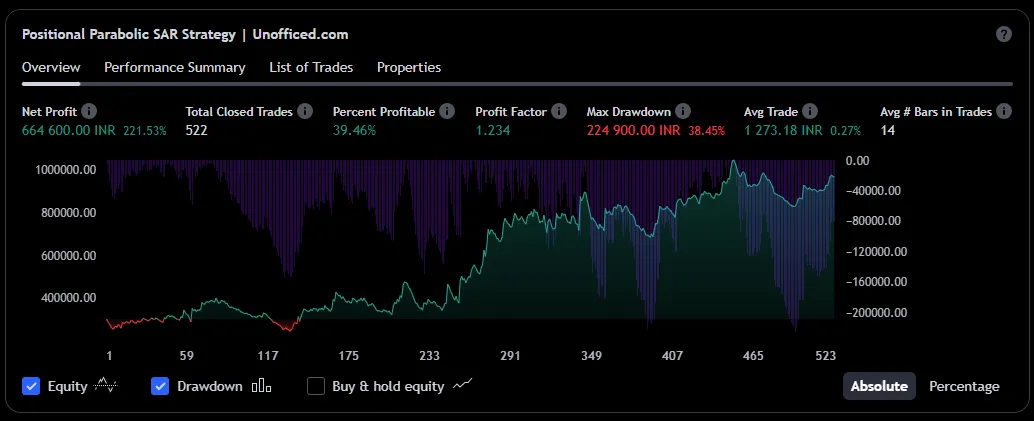
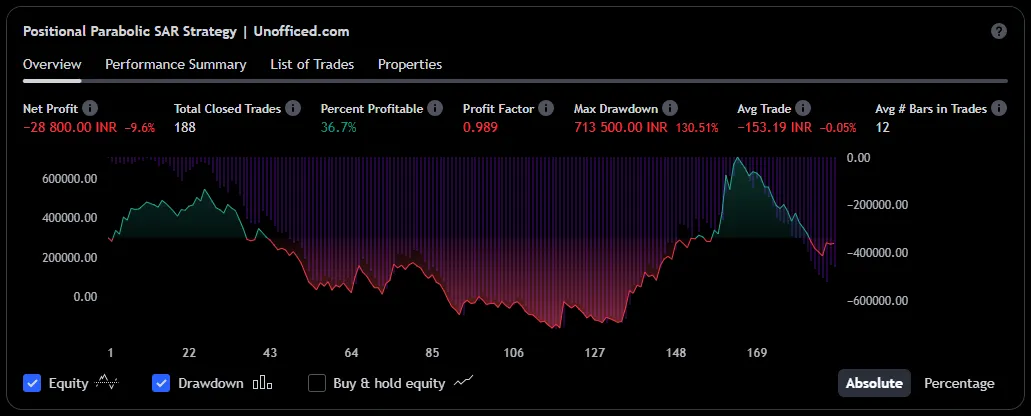
Backtesting Reliance Futures
We will backtest on Reliance Futures with a notional capital of Rs. 3 lakh. While margins have varied, they have rarely exceeded Rs. 1.5 lakh for one lot, so this capital provides a safe buffer against drawdowns.
15 Minutes Timeframe
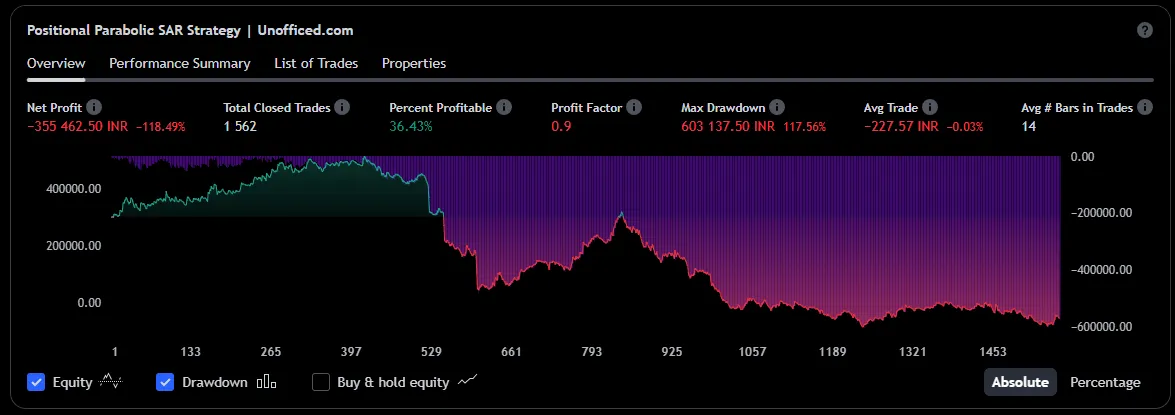
Checkout The Results in Tradingview
30 Minutes Timeframe
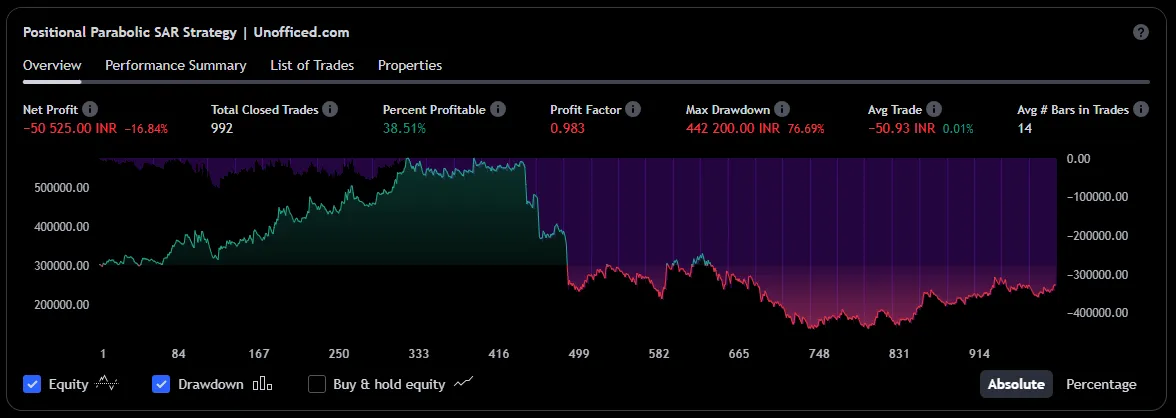
Checkout The Results in Tradingview
1 Hour Timeframe
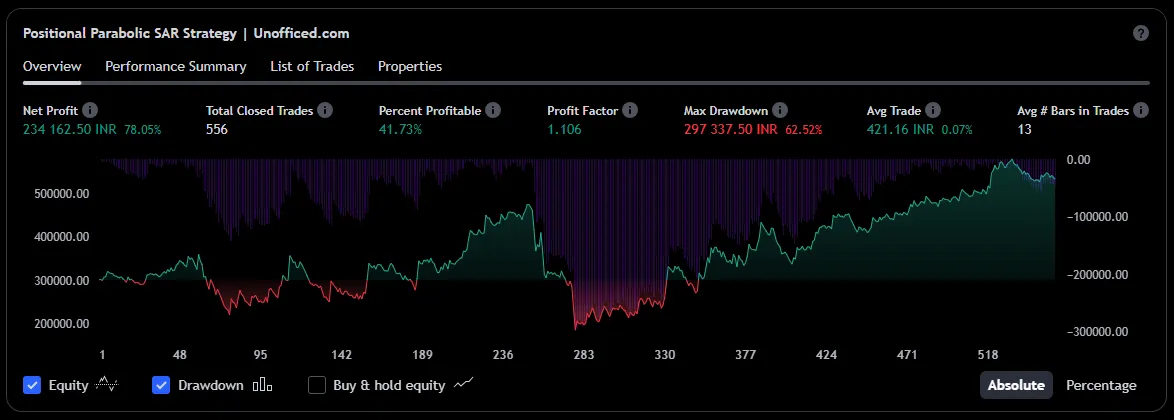
Checkout The Results in Tradingview
1 Day Timeframe
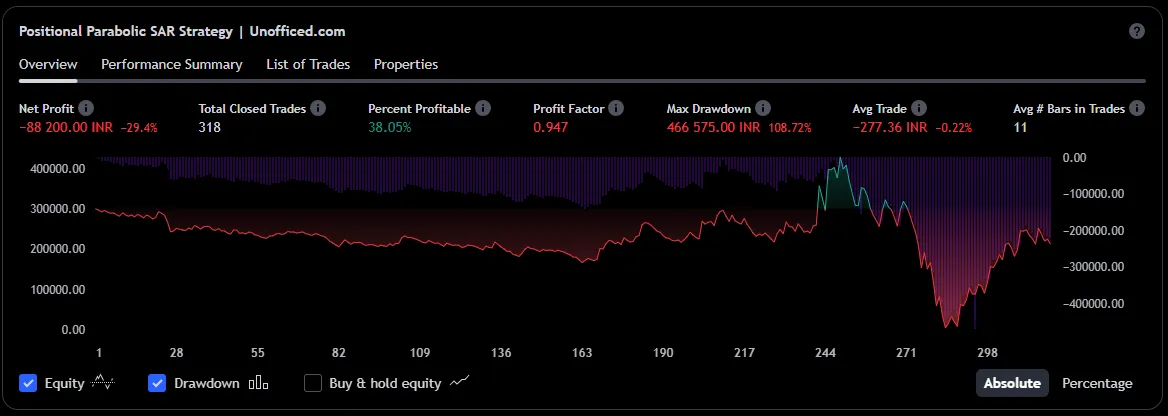
Checkout The Results in Tradingview
1 Week Timeframe
Checkout The Results in Tradingview
1 Month Timeframe
Checkout The Results in Tradingview
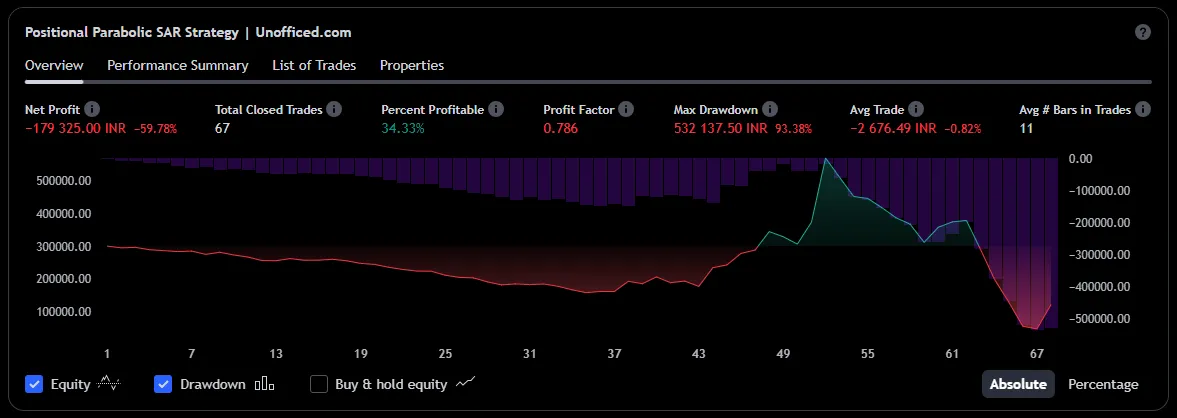
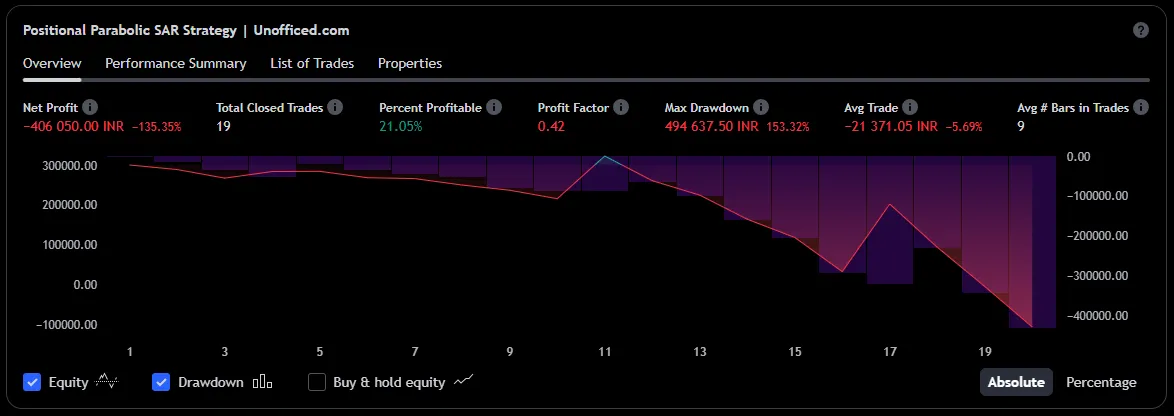
Analysis of Reliance Results
The results are revealing. With the notable exception of the 1-hour timeframe, Reliance incurred substantial losses across all other charts. Even on the 1-hour chart, the equity curve shows significant volatility and an “absolute drawdown,” where the capital dipped below the starting amount. This is a characteristic of a system experiencing severe whipsaws.
This leads to a critical observation: large-cap stocks, even an index heavyweight like Reliance, are not always trending. They can spend significant time in choppy, range-bound phases. Applying a pure trend-following system like Parabolic SAR to such an instrument is a recipe for being stopped out repeatedly for small losses, which accumulate over time.
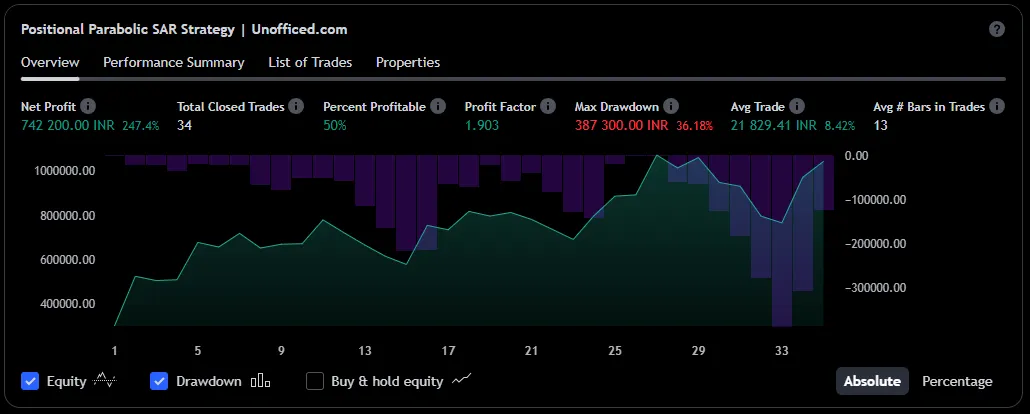
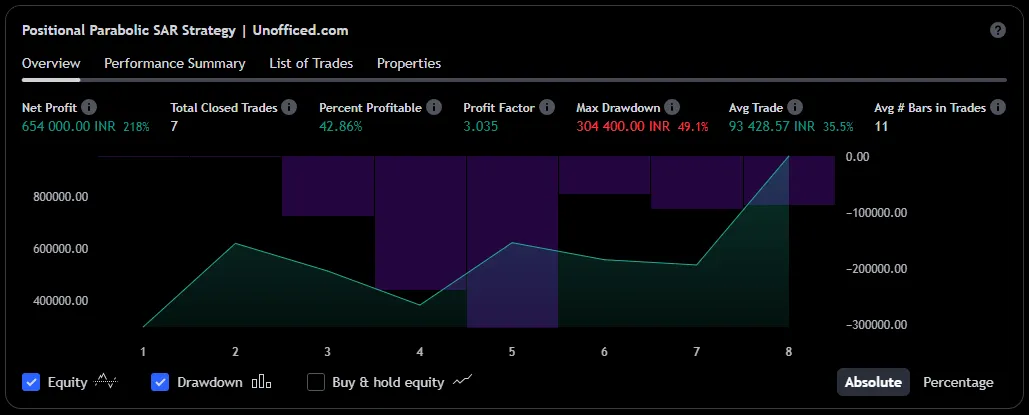
Backtesting Vedanta Futures
Now, let’s turn our attention to Vedanta. As a commodity-based company, its stock price is heavily influenced by global metal price cycles. This often results in prolonged, powerful trends, making it a theoretically better candidate for the Parabolic SAR strategy.
15 Minutes Timeframe
Checkout The Results in Tradingview
30 Minutes Timeframe
Checkout The Results in Tradingview
1 Hour Timeframe
Checkout The Results in Tradingview
1 Day Timeframe
Checkout The Results in Tradingview
1 Week Timeframe
Checkout The Results in Tradingview
1 Month Timeframe
Checkout The Results in Tradingview
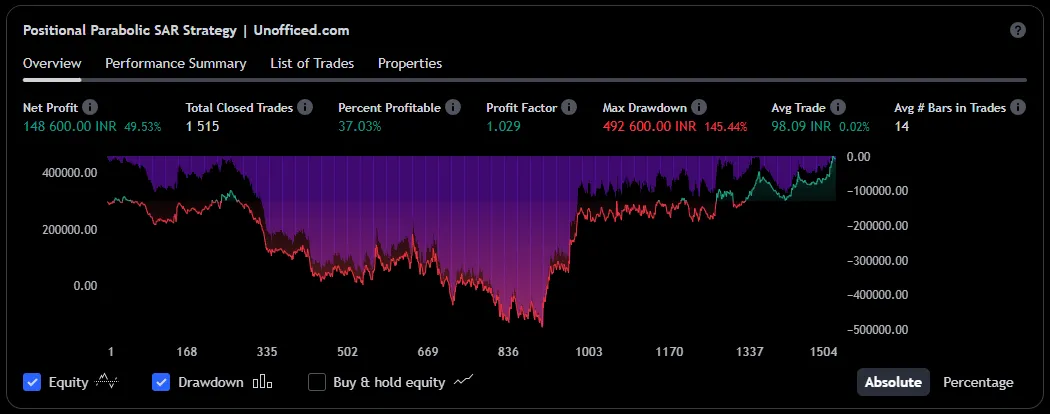
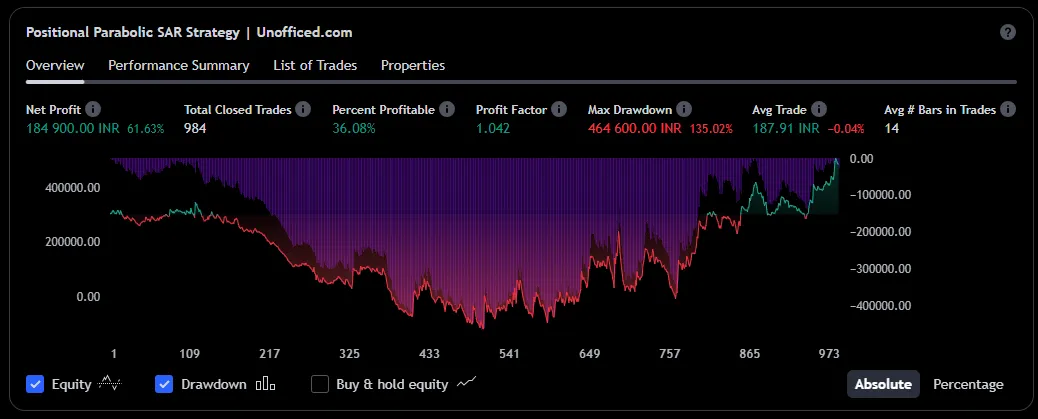
Analysis of Vedanta Results
The difference is night and day. As anticipated, the strategy was robustly profitable on Vedanta across most timeframes, especially the longer ones (1-Day, 1-Week, 1-Month). The smooth, upward-sloping equity curves are characteristic of a strategy that has successfully captured large, sustained moves.
This confirms our hypothesis: the Parabolic SAR system thrives on instruments that exhibit clear, cyclical trending behaviour.
Backtesting ≠ Future Performance
While these results are insightful, they are not a guarantee of future profits. It is crucial to maintain a healthy skepticism towards backtesting.
- Past vs. Future: Backtests show what worked in the past. They cannot account for future structural changes in the market. A strategy’s historical performance does not guarantee future results.
- Overfitting: When we test a strategy across many instruments and timeframes, we risk “data snooping” or “overfitting.” By searching for the timeframe where a strategy performed well (like the 1-hour chart on Reliance), we may be selecting for random chance rather than a genuine edge. A truly robust system should show profitability across a range of related parameters and timeframes.
- Execution Costs: Real-world trading involves costs that backtests often ignore. Brokerage fees, taxes, and slippage (the difference between the expected and actual execution price) can significantly erode the profitability of a strategy.
In the next chapter, we will explore how to combine the Parabolic SAR with other indicators, like the ADX, to help filter out the choppy, non-trending periods where it performs poorly.