Trend Insights with Parabolic SAR
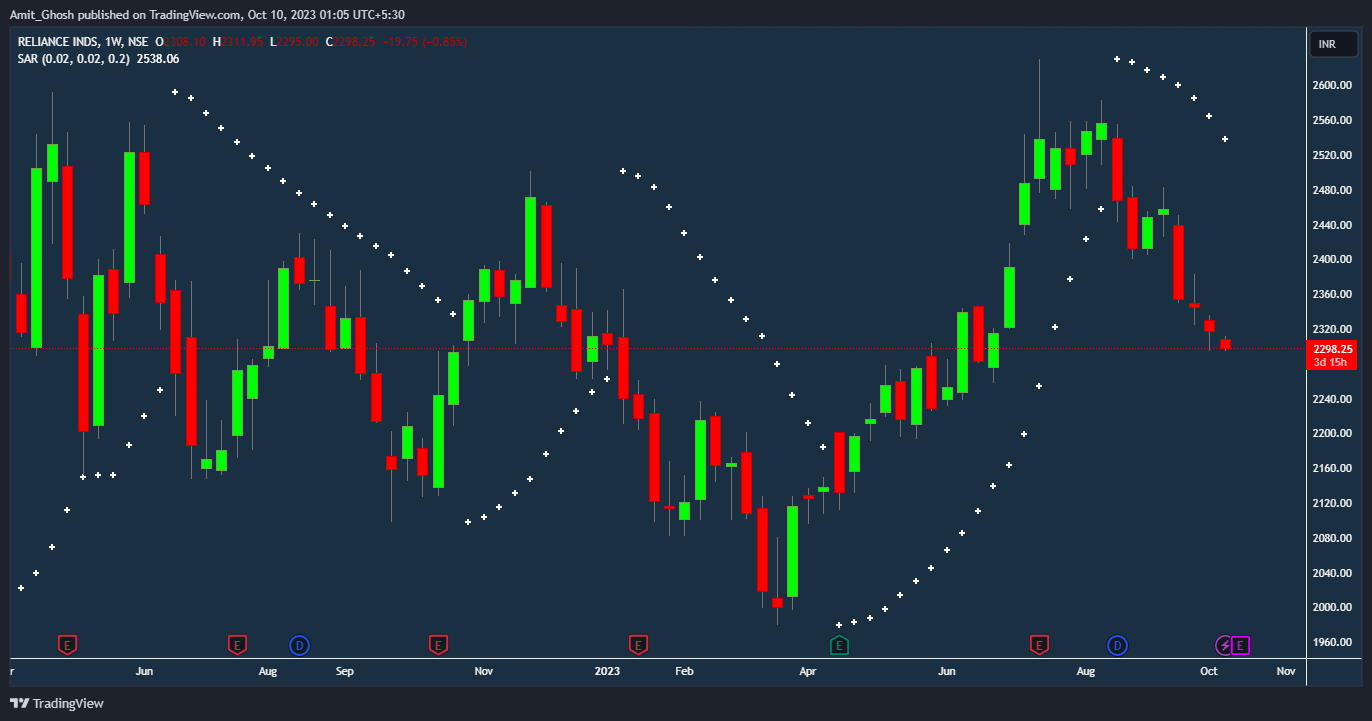
The Parabolic SAR, abbreviated as SAR (Stop and Reverse), is a trend-following indicator that’s crucial for traders looking to spot price action reversals. The Parabolic SAR is displayed on charts through a series of small dots positioned either above or below the price depending on the trend direction.
J. Welles Wilder developed the Parabolic SAR in his 1976 book “New Concepts In Technical Trading Systems“. This book not only introduced the Parabolic SAR but also other significant technical indicators like the Relative Strength Index (RSI) and the Average Directional Index (ADX).
Recognizing Trend Directions
The unique positioning of SAR dots facilitates a rapid comprehension of market trends:
- Uptrend Detection: In a bullish market scenario, the SAR dots align below the price action, signaling a favorable terrain for potential buying opportunities.
- Downtrend Identification: Conversely, during a bearish phase, the SAR dots appear above the price action, denoting a possible selling sphere.
The seamless transition of the SAR dots as the market ebbs and flows paves the path for traders to stay in sync with the prevailing market rhythm, thereby nurturing the groundwork for well-informed trading decisions.

Reading the Indicator:
The Parabolic SAR follows the price movement closely as it moves along a trend, waiting to catch signs of a possible change in direction.
As the current trend starts to slow down and looks like it’s coming to an end, the Parabolic SAR moves closer and closer to the price. Eventually, the price touches the dots of the Parabolic SAR on the chart. When this happens, the Parabolic SAR dots switch to the other side of the price, showing that the price is likely changing direction. This switch helps traders see that the trend is shifting, and helps them plan their trades accordingly.
Using the Parabolic SAR:
Identifying Trends:
- The Parabolic SAR is great for showing the general trend of an asset.
- It works well in trending markets but can give false signals in sideways markets.
Spotting Entry and Exit Points:
- The transition of dots from one side of the price to the other can signal entry or exit points.
- It’s also used for setting stop-loss orders, especially in trending markets.
Setting Trailing Stops:
- Traders can use the Parabolic SAR to adjust stop-loss orders to follow the current trend, which can help protect profits.

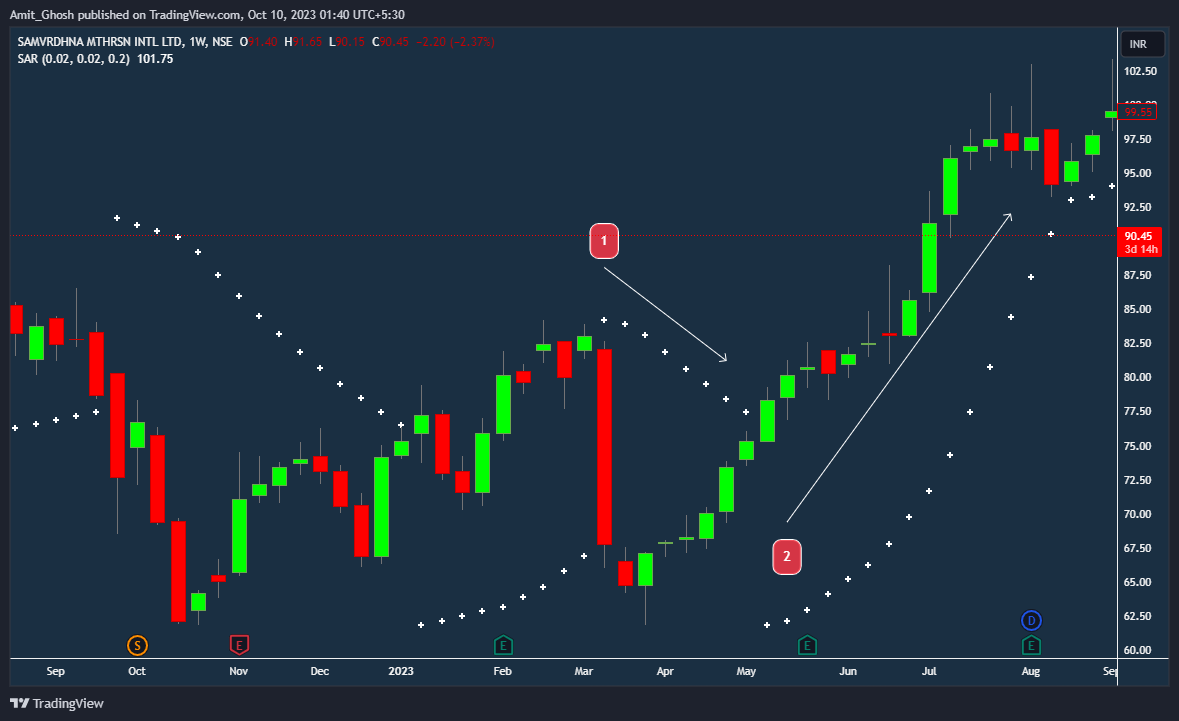
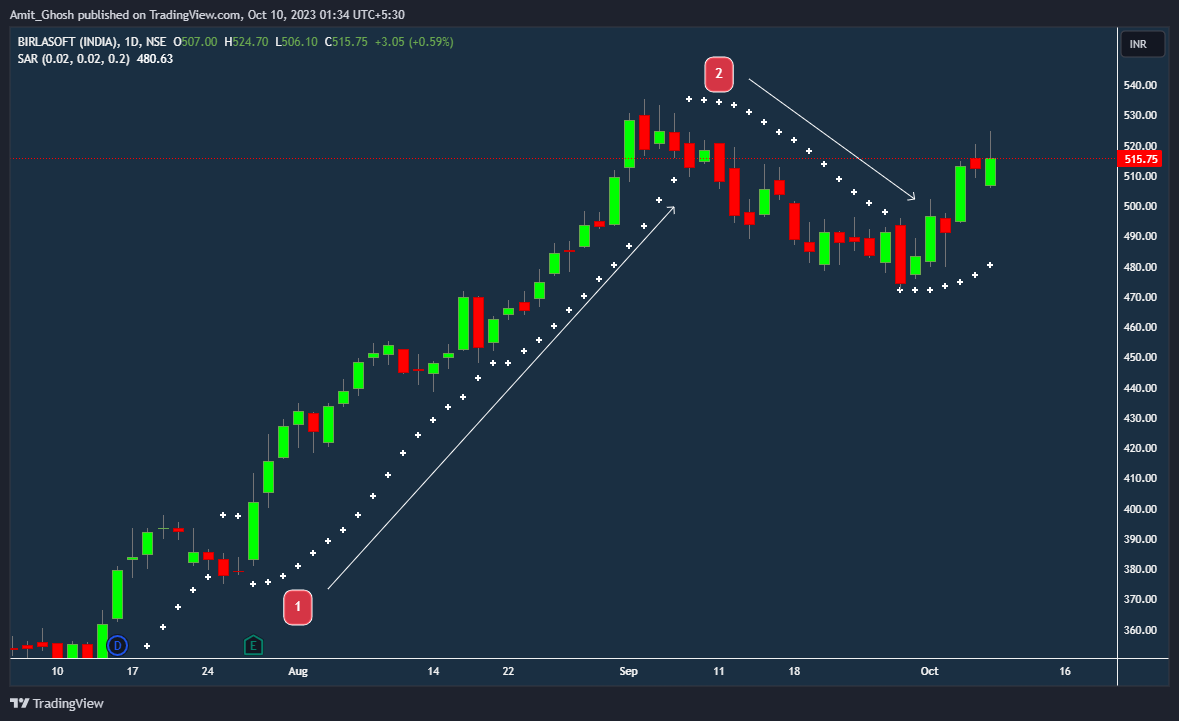
- SAR signaling an upward trend
- SAR tracking the upward trend
In the illustration above, observe how the SAR is positioned below the price as it climbs upward. Once the upward movement reaches its end, the price touches the SAR, indicating a potential shift in the trend towards a downward direction.

- SAR marks the uptrend’s end, hinting at a reversal.
- SAR tracking the downtrend.
In the displayed example above, the SAR positions itself above the price, indicating a downtrend. It follows the price as it moves down, until the trend exhausts and the price touches the SAR, signaling the downtrend’s end and a possible shift to an upward trend.
Traders can utilize the SAR to discern the trend’s direction. Furthermore, the SAR is useful for managing trailing stop losses, adjusting the stop loss position closely behind each new SAR formation, until the price reverses, potentially locking in profits for the traders.
- The Parabolic SAR (stop and reverse) indicator is a tool employed by technical traders to identify trends and potential reversals.
- This indicator employs a series of dots displayed on a price chart.
- A shift is noted when these dots switch positions, but such a shift in the SAR doesn’t always signify a price reversal. A PSAR shift merely indicates that there has been a crossover between the price and the indicator.

