The Parabolic SAR Trading Strategy

The Parabolic SAR Trading Strategy
The Parabolic SAR (SAR for Stop and Reverse) is a versatile technical indicator developed by the renowned technical analyst J. Welles Wilder Jr., the same mind behind indicators like the RSI and ADX. Its primary function is to identify the direction of a market’s trend and provide dynamic entry and exit points. As a trend-following indicator, it thrives in markets with clear directional momentum but can be susceptible to whipsaws in sideways conditions. This chapter delves into the mechanics of the Parabolic SAR and a trading strategy built around it.
The indicator is a standard feature on all major trading platforms. For our discussion, we will use TradingView with its default settings (Start: 0.02, Increment: 0.02, Max: 0.2) to analyse its application on Indian equities.
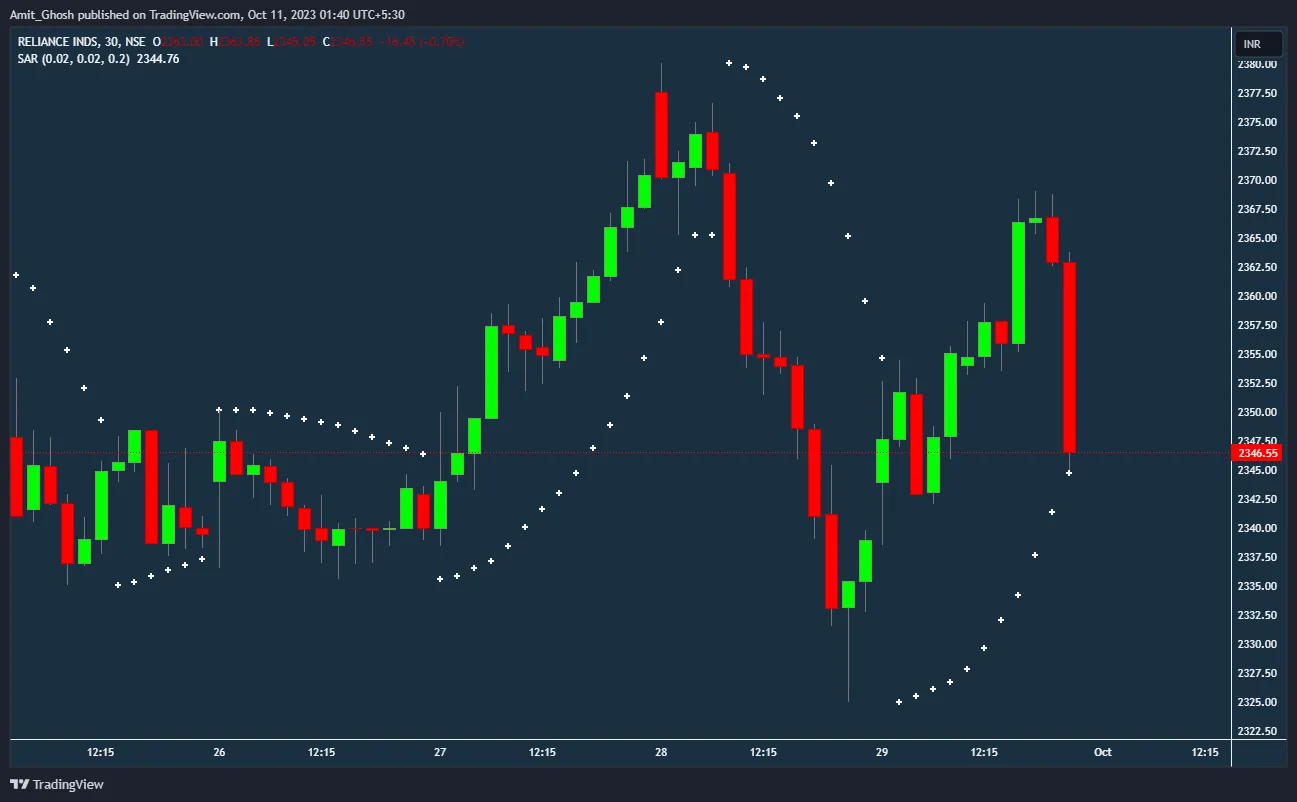
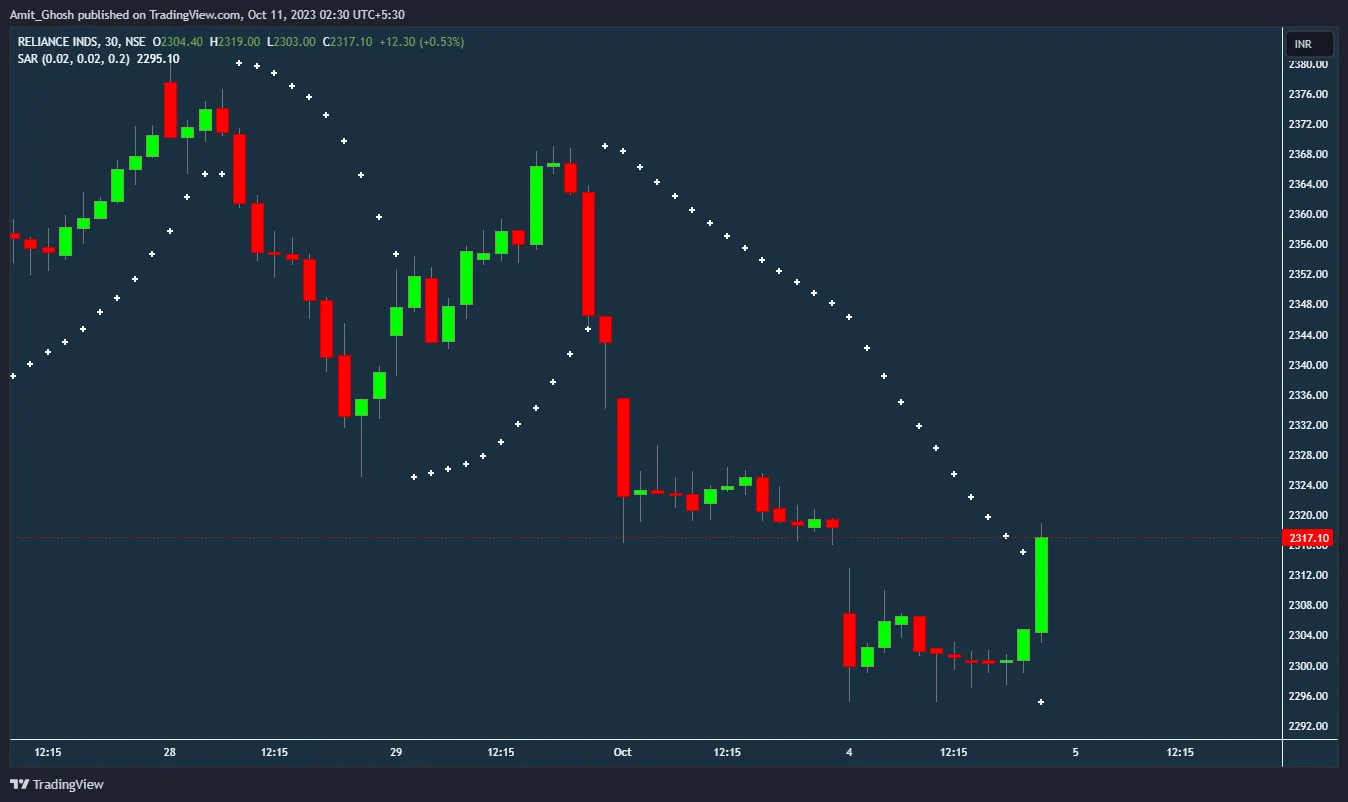
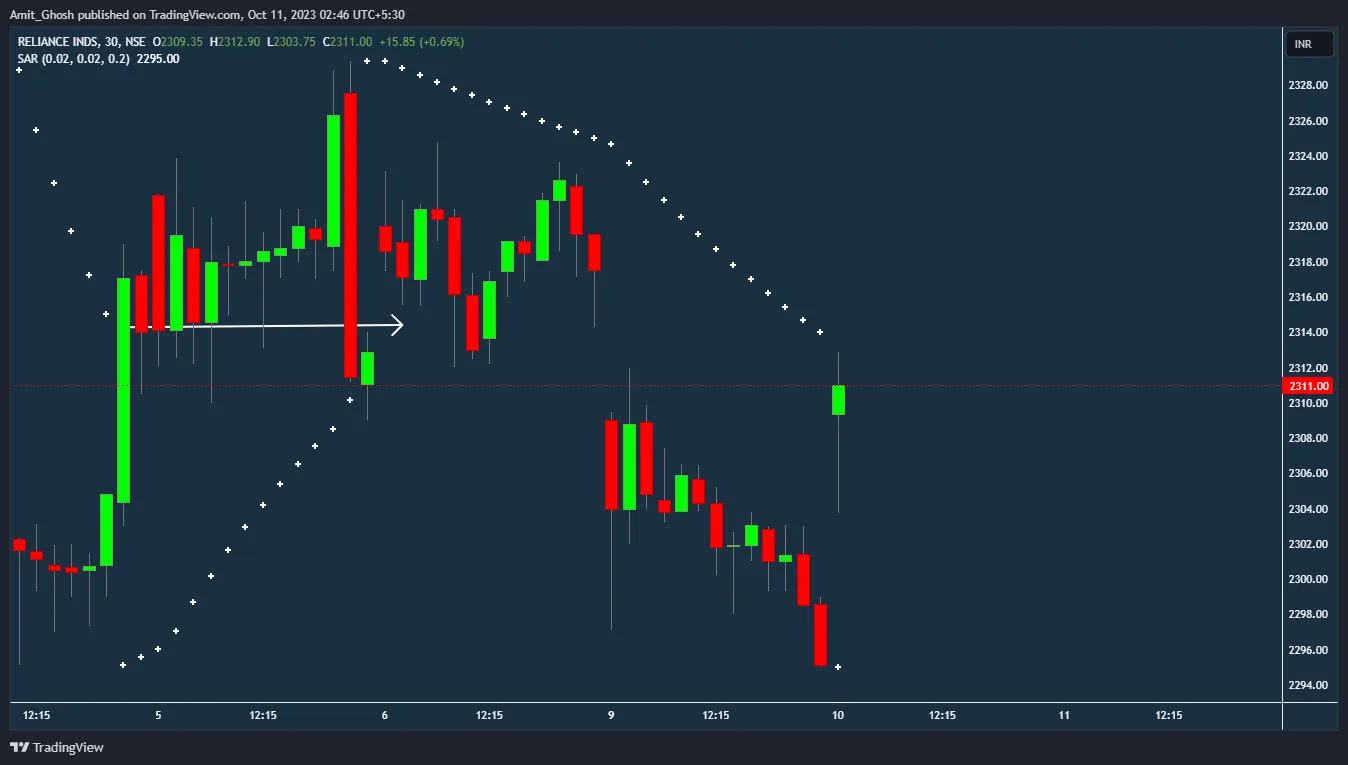
In the chart below, the Parabolic SAR is applied to a 30-minute timeframe of Reliance Industries. The small dots plotted either above or below the price candles constitute the indicator.
From here on, we will refer to the Parabolic SAR as PSAR.
Core Principle: The “Stop and Reverse” System
The name “Stop and Reverse” perfectly encapsulates the strategy’s core logic. The PSAR system is always in the market; it does not have a “neutral” state. The exit signal for a long position is simultaneously the entry signal for a short position, and vice versa. The PSAR dots themselves represent the trailing stop-loss for the current position.
- When the dots are below the candles, the market is considered to be in an uptrend, and you should be in a long position.
- When the dots are above the candles, the market is in a downtrend, and you should be in a short position.
- A reversal occurs when the price touches or crosses the PSAR dot.
The Mathematical Underpinnings of PSAR
The PSAR calculation is iterative, meaning each period’s value depends on the value from the previous period. The formula adjusts based on whether the trend is rising or falling.
The core formula is:
Where:
- is the SAR value for the next period.
- is the SAR value for the current period.
- (Extreme Point) is the highest high recorded so far in the current uptrend, or the lowest low in the current downtrend.
- (Acceleration Factor) is a variable that controls the sensitivity of the SAR. It starts at a default value (e.g., 0.02) and increases by an increment (e.g., 0.02) each time a new EP is established during the trade, up to a maximum value (e.g., 0.20).
The calculation also includes rules to prevent the SAR from moving into the prior period’s price range, ensuring it consistently trails the price action.
A Practical Walkthrough in Reliance
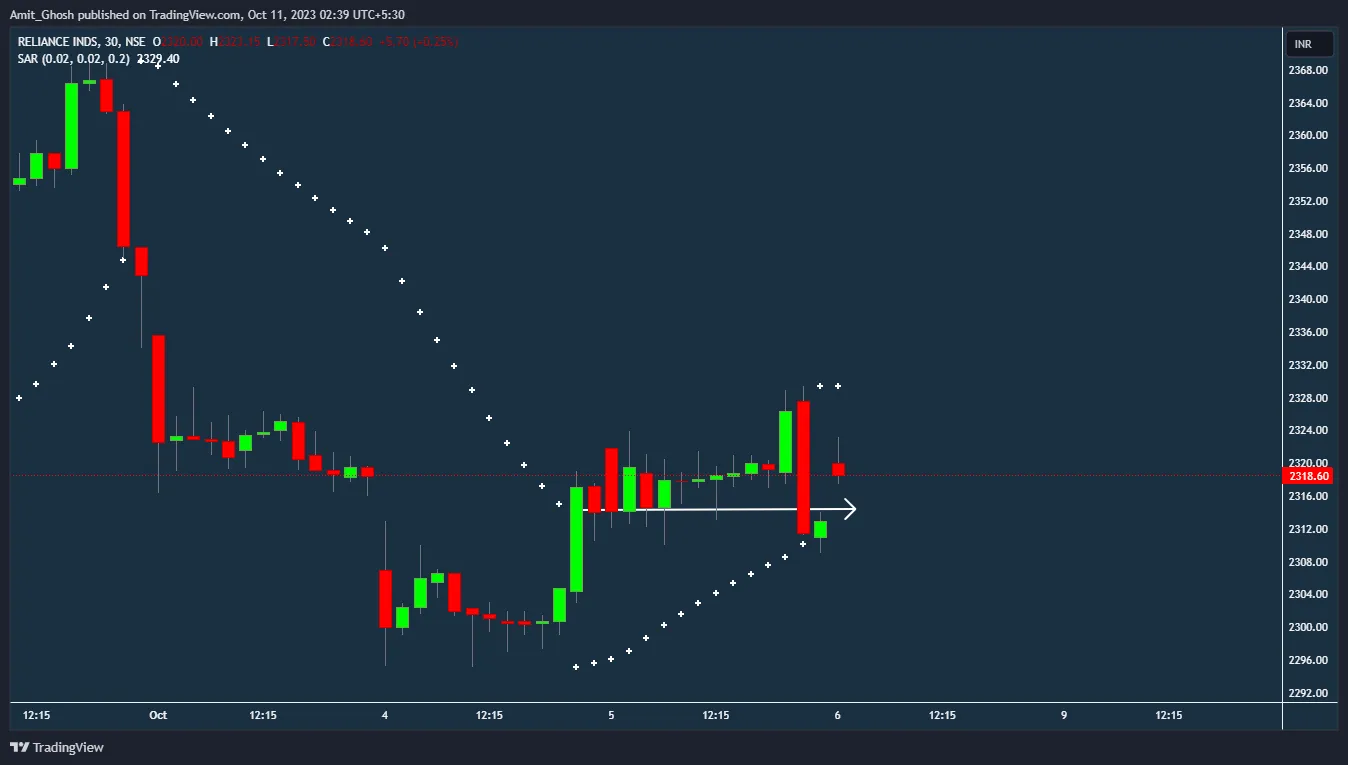
Let’s observe the strategy in action on the Reliance chart. We begin in an uptrend, with the PSAR dots below the price.
In the candle highlighted below, you can see the price is very close to touching the PSAR dot below it. This is a warning sign: the uptrend’s momentum is fading, and a reversal to a short position might be imminent.
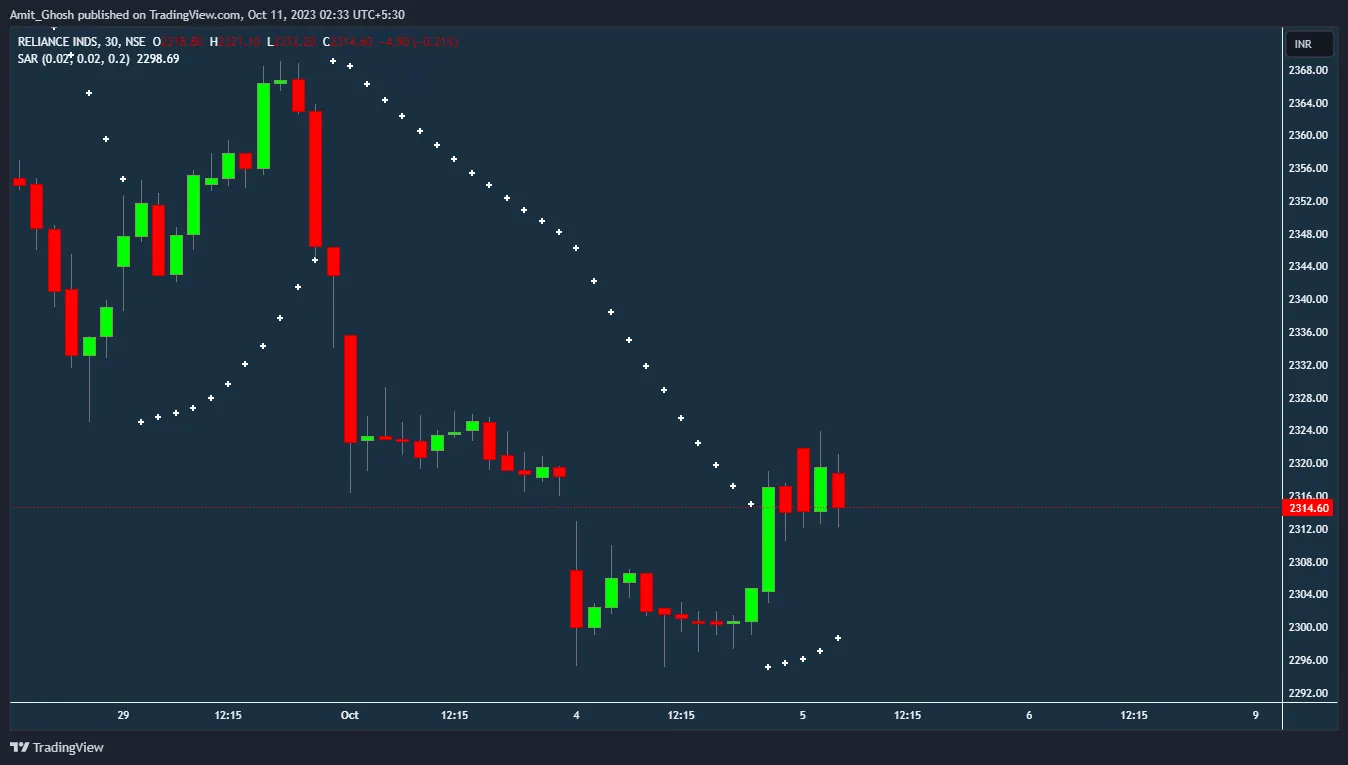
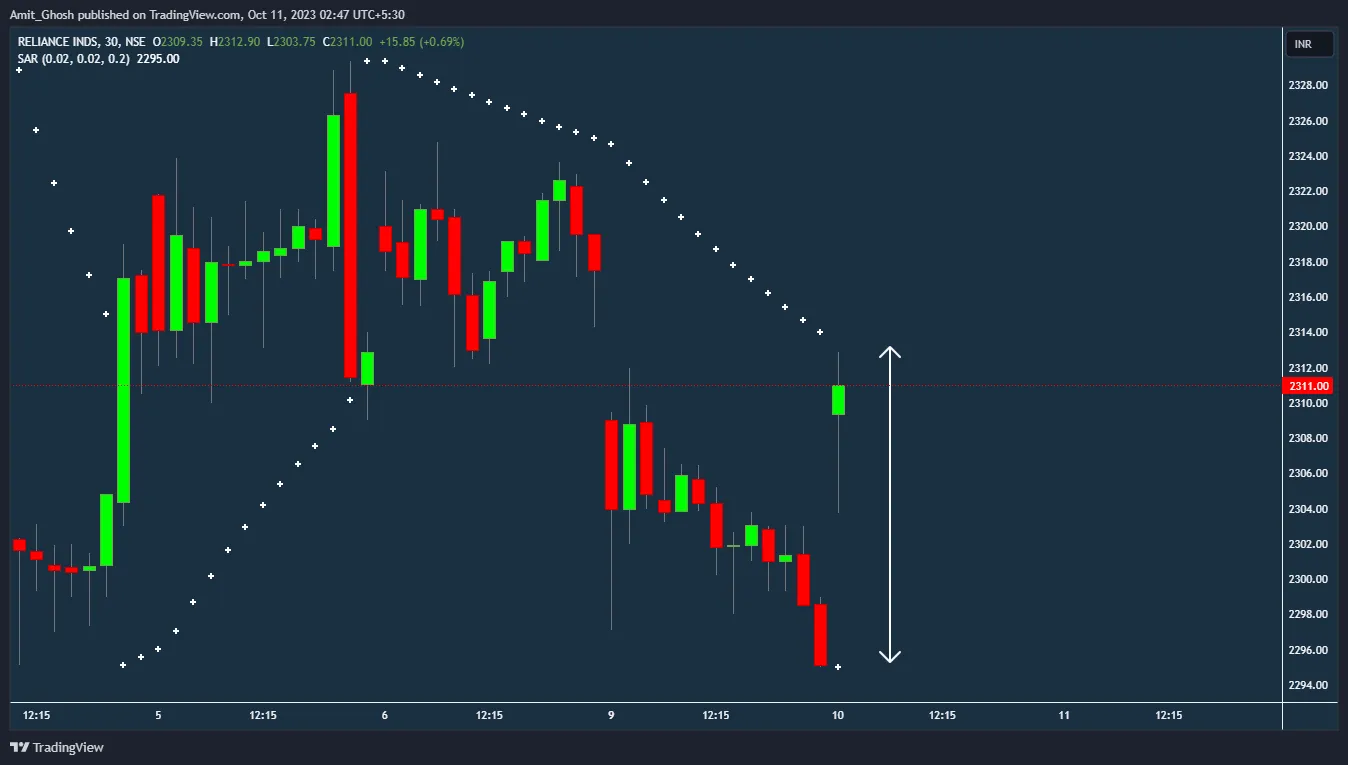
In the very next candle, the price pierces the SAR dot. This triggers an exit from the long position and an immediate entry into a new short trade.
The brilliance of the PSAR strategy lies in this mechanical nature. The stop-loss for one trade becomes the entry point for the next. At the moment a trade is initiated, the final target and risk-reward ratio are unknown; they are dynamic and will be determined by how the trend evolves.
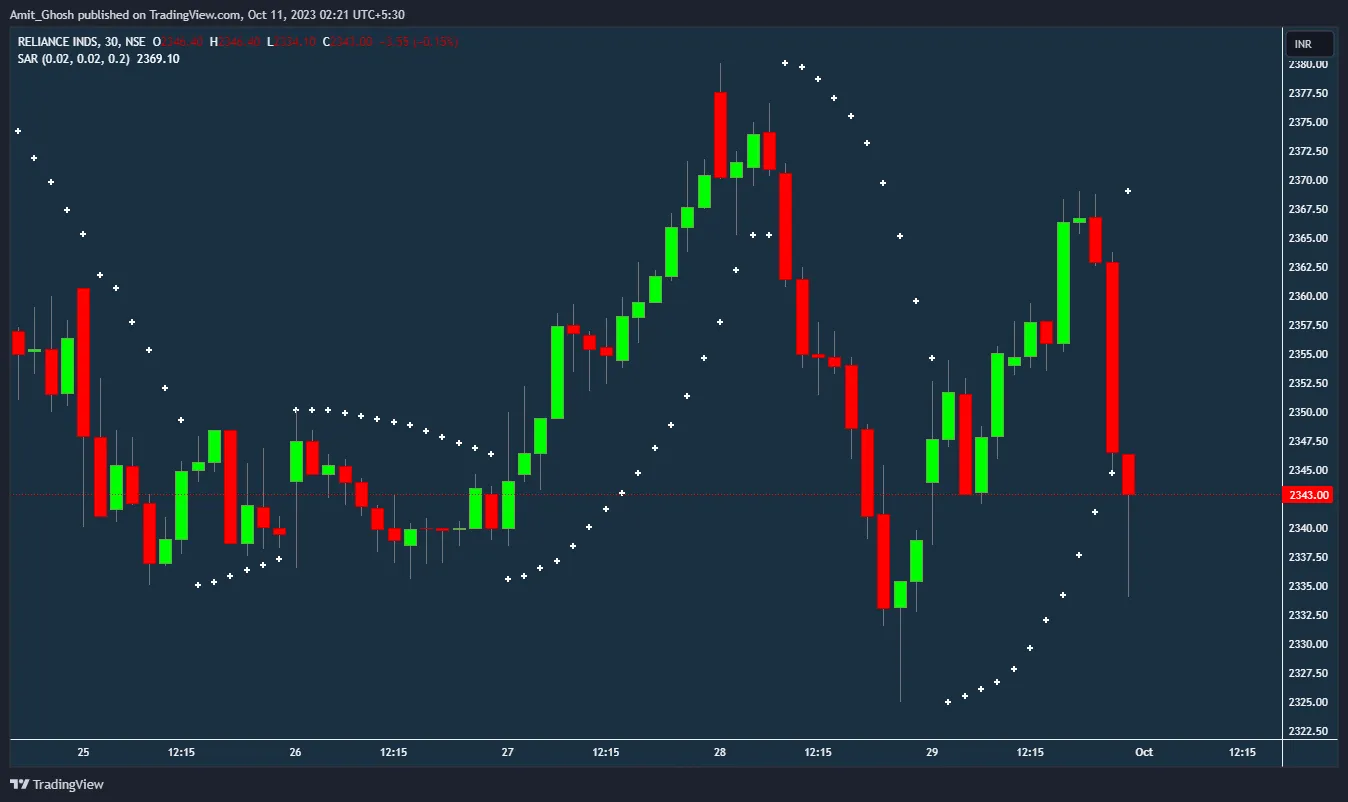
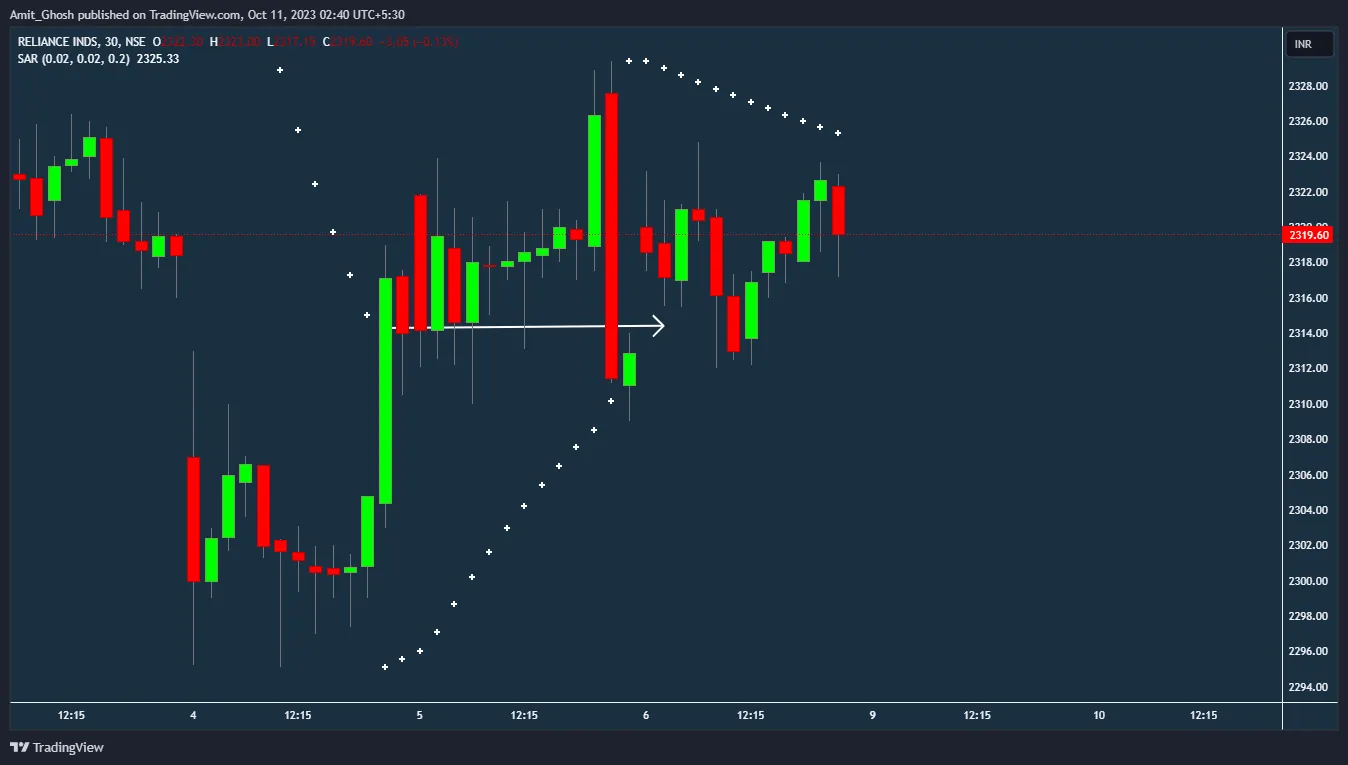
A few candles later, the decision to go short proves profitable as the price has fallen significantly.
The trade continues to progress favorably. Notice how the PSAR dots, now above the price, act as a trailing stop-loss, moving lower with each new period.
The Challenge of Sideways Markets
A common question is whether one can anticipate a trend reversal ahead of time to avoid taking the trade. The answer is generally no. The system is designed to be reactive, not predictive. Trying to second-guess the signals often leads to missed opportunities or poor trade management.
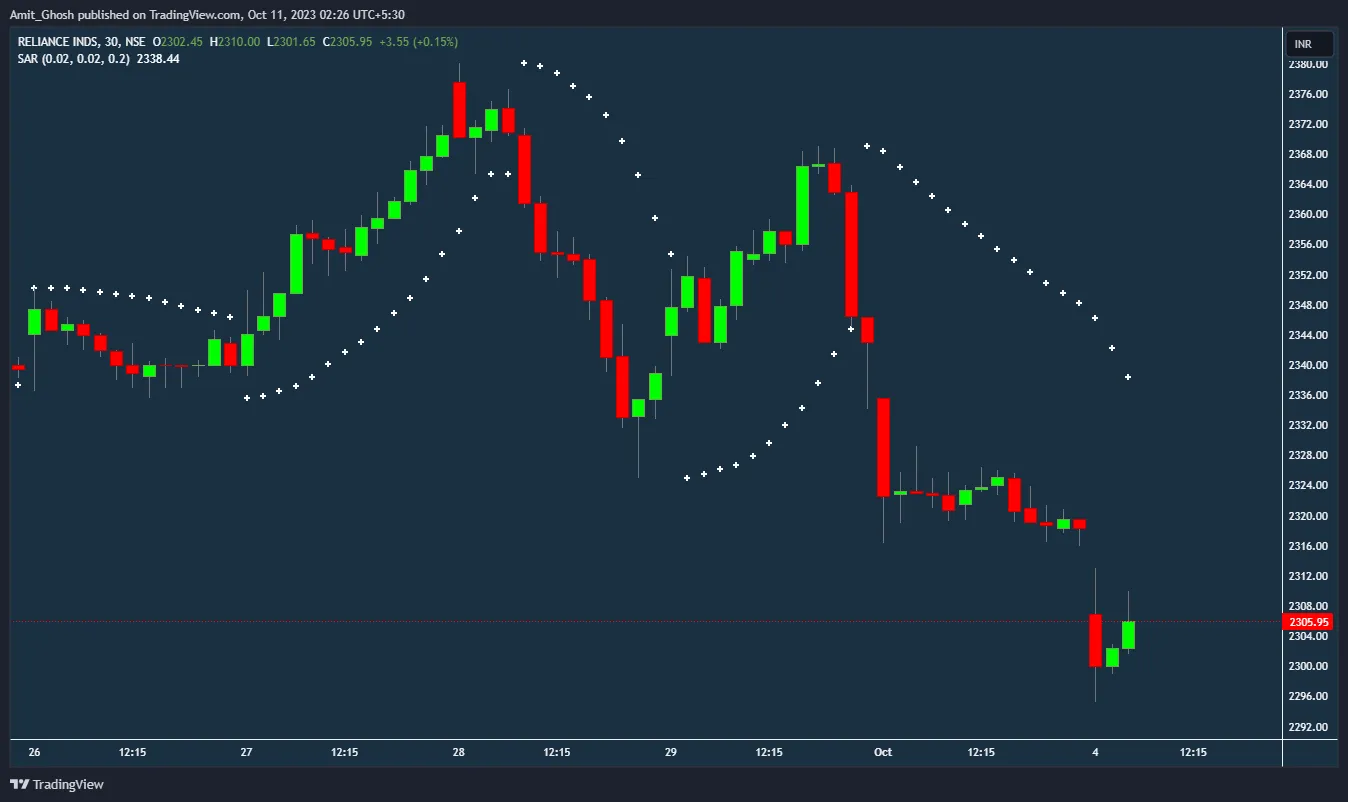
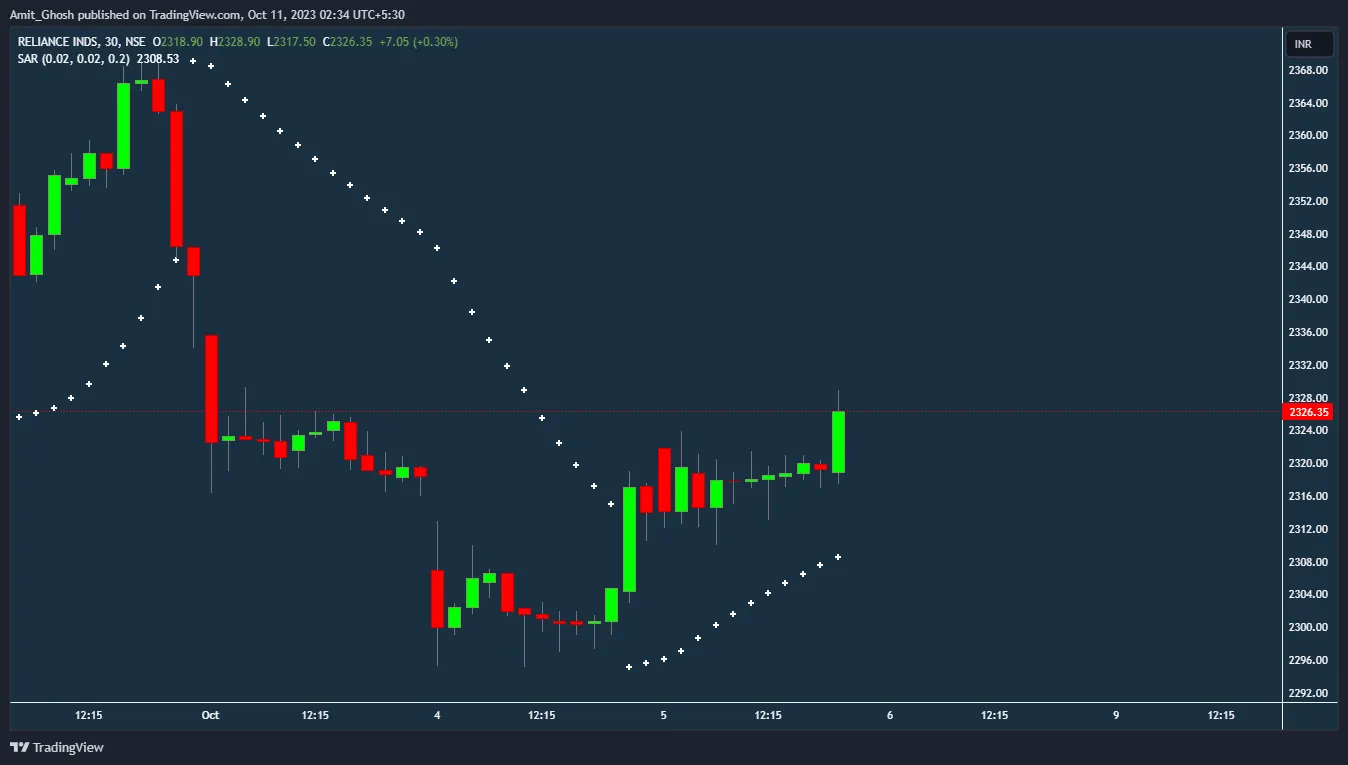
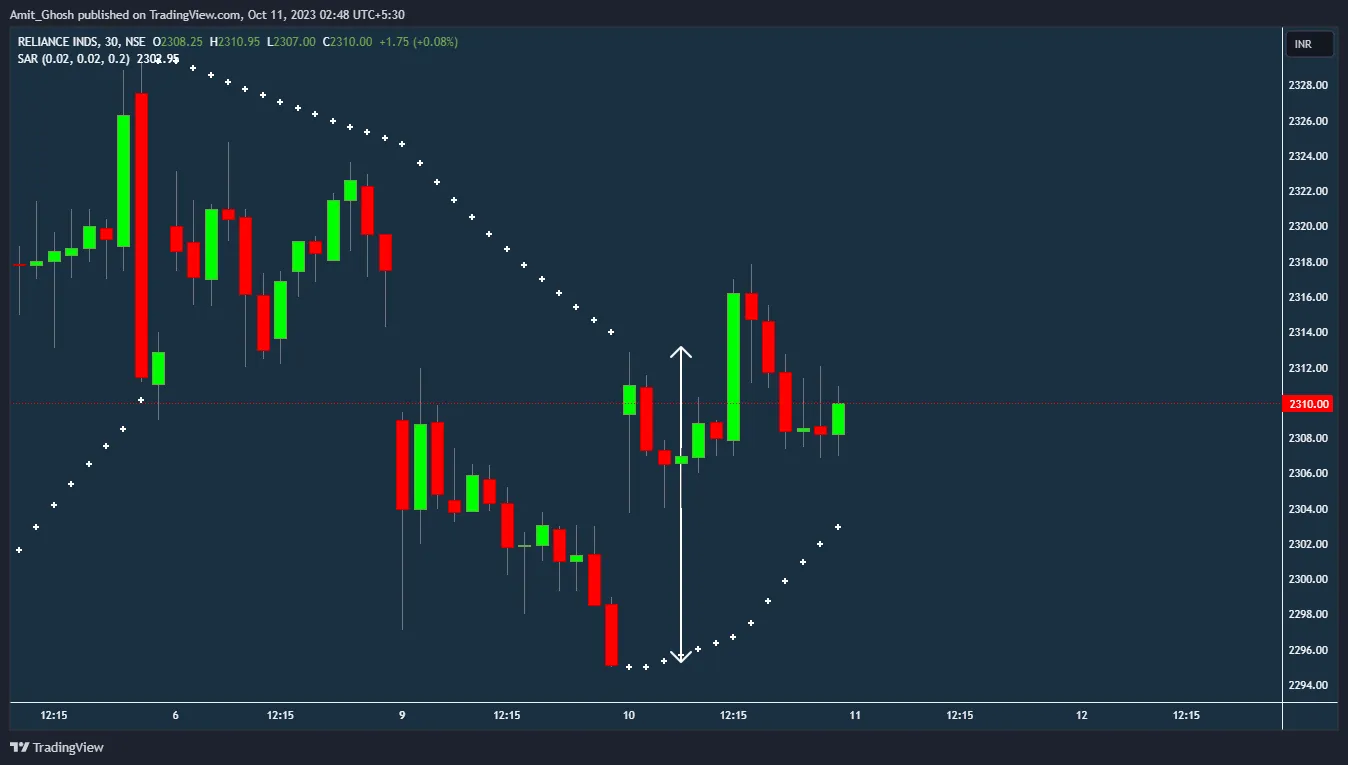
The chart below shows an unexpected, sharp bullish candle that triggers a buy order, reversing our profitable short trade. The prior downtrend appeared strong, making this reversal feel counter-intuitive.
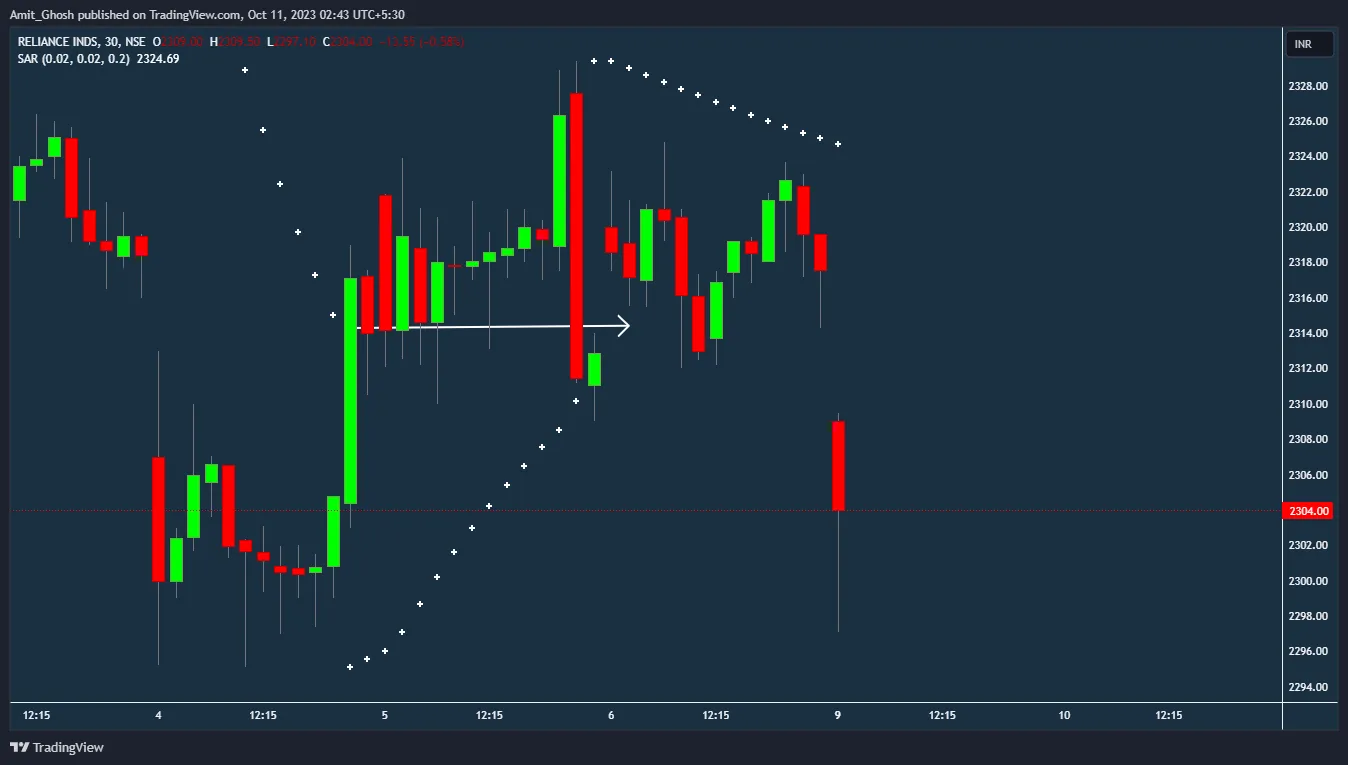
However, this new long trade shows a weak start. Unlike the previous short trade which saw a sharp initial drop, this one begins to consolidate immediately.
After a few more candles, the price is still stuck in a range, failing to show any real upward momentum.
Soon after, the price drops and hits the PSAR dot below it, screaming for an exit from the long trade and an entry back into a short position.
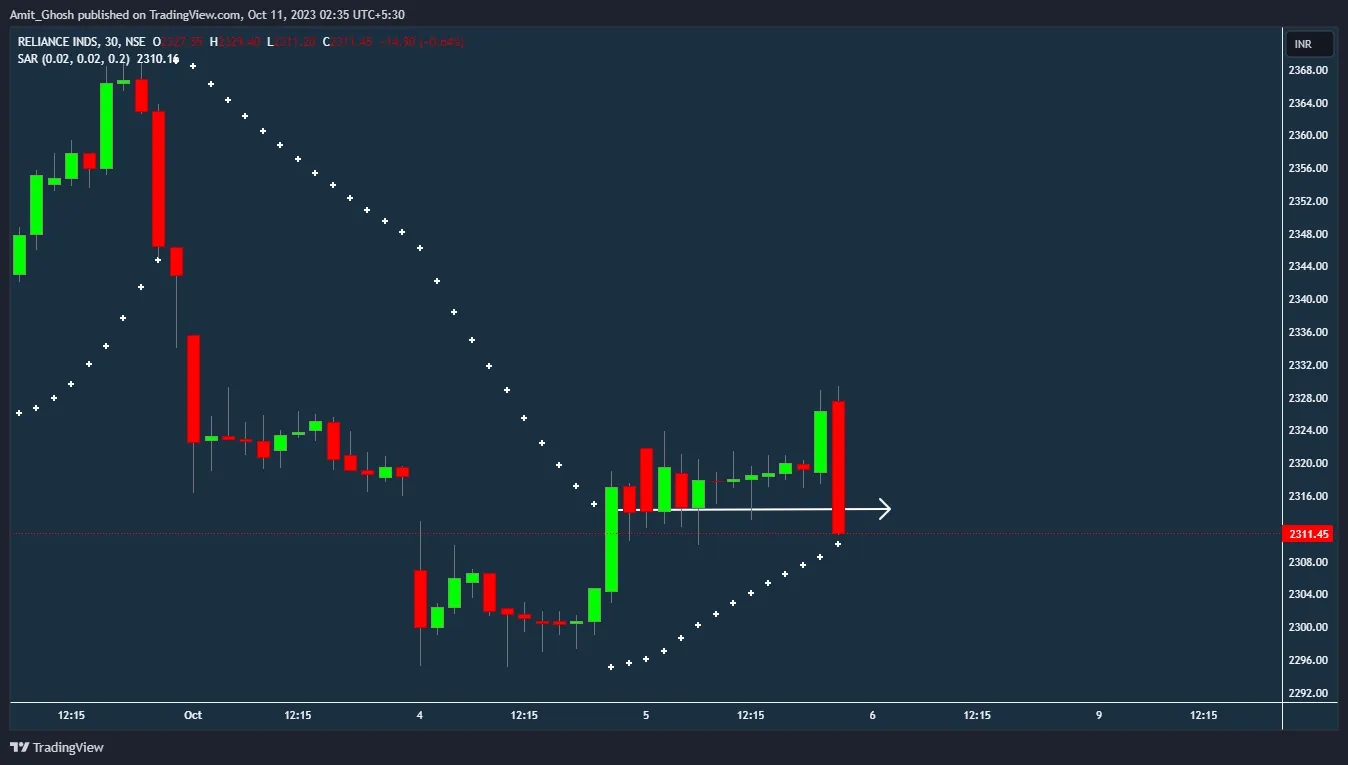
This sequence is a classic example of a “whipsaw”—a common problem when using trend-following indicators like PSAR in a sideways or range-bound market. The strategy generates a series of small, losing trades as it flips between long and short signals without any sustained follow-through.
Sticking to the System: Psychology vs. Mechanics
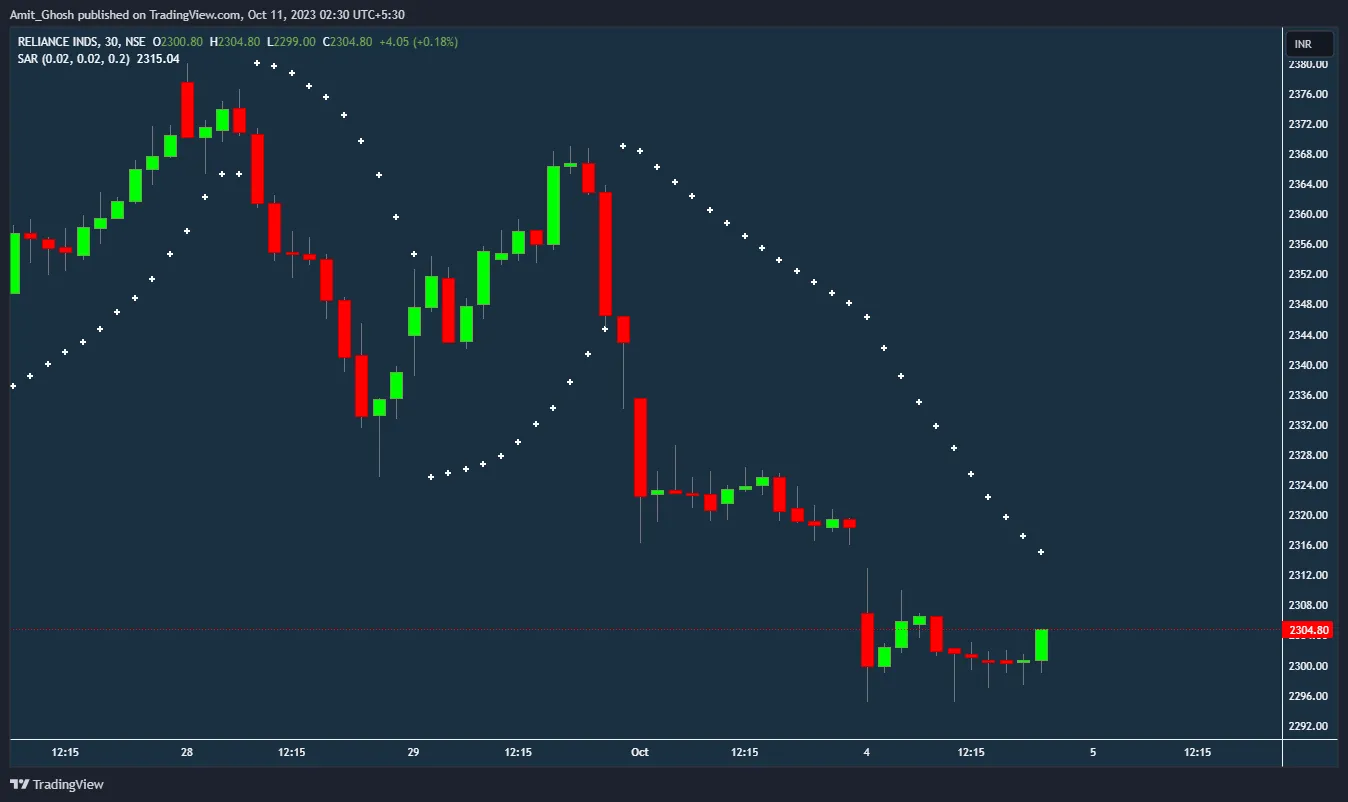
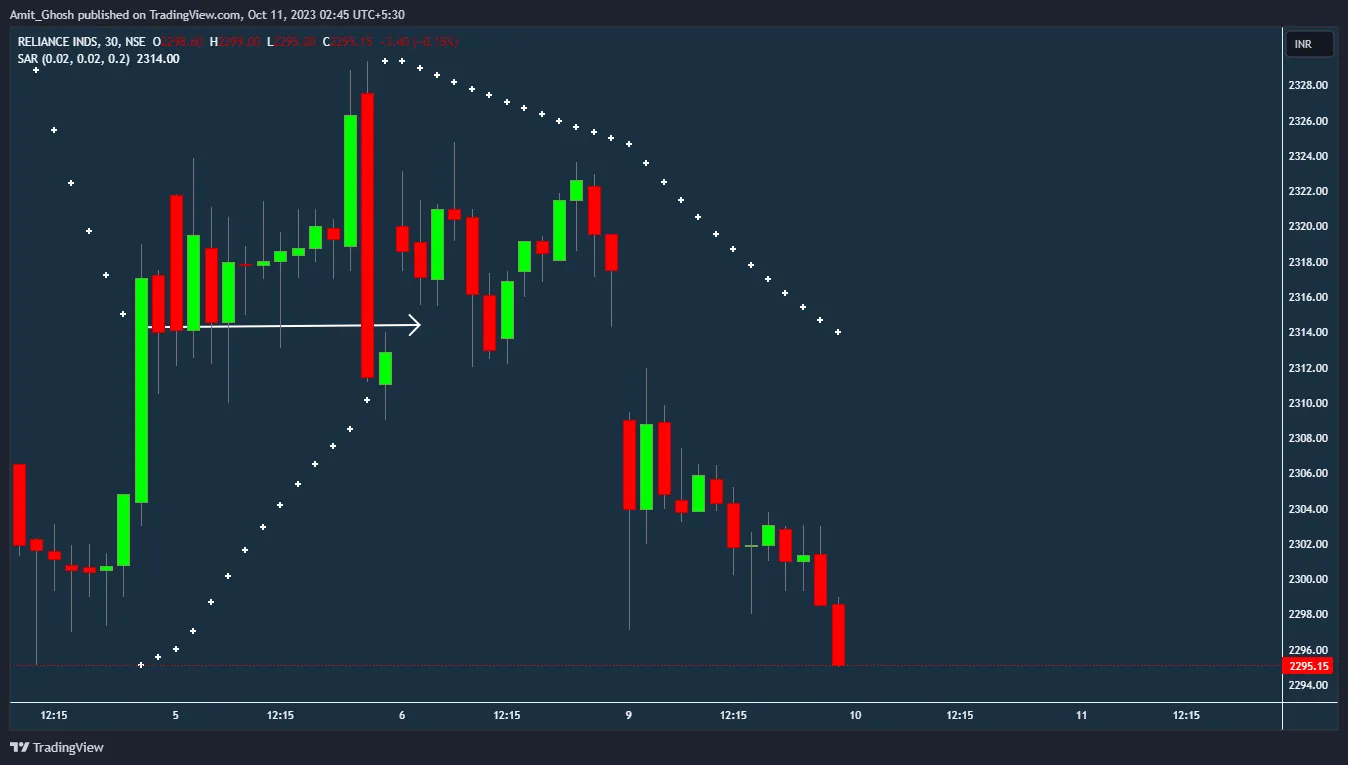
Following the whipsaw, we are now in another short trade. The next day, the market gaps up, immediately challenging the new position.
The price is back in the same consolidation zone. Price action theory suggests that this range-bound behaviour is likely to continue, making a trader fearful of another stop-loss hit.
The fear materializes as the price chops around within the range, getting dangerously close to the PSAR value above it.
Here, human psychology screams to exit the trade to avoid another loss. However, the mechanical system dictates holding the position until the PSAR is breached. This is where discipline becomes paramount.
Despite the consolidation and our psychological bias, the mechanical approach ultimately wins. The market gaps down and a huge fall follows, turning the trade handsomely profitable.
This outcome is a powerful lesson: our intuition, designed to avoid immediate pain, can often manipulate us into betraying a trading system whose edge is based on long-term probabilities, not on the outcome of any single trade.
The trade continues to be in good profit.
And just as unpredictably, the next day brings a significant gap up, triggering a buy signal and reversing the position once again.
The entire profit from the previous day’s successful trade is wiped out and turns into a loss in a single candle. This highlights the reality of “giveback” in trend-following systems.
And right now, the market is again back to its familiar consolidating behaviour.
Backtesting Results and Interpretation
We can codify this strategy and backtest it directly in TradingView. The chart below displays the strategy tester results for the sequence of trades we just analysed, using a position size of 500 shares of Reliance.
We have coded this script in the next chapter. Check it out.
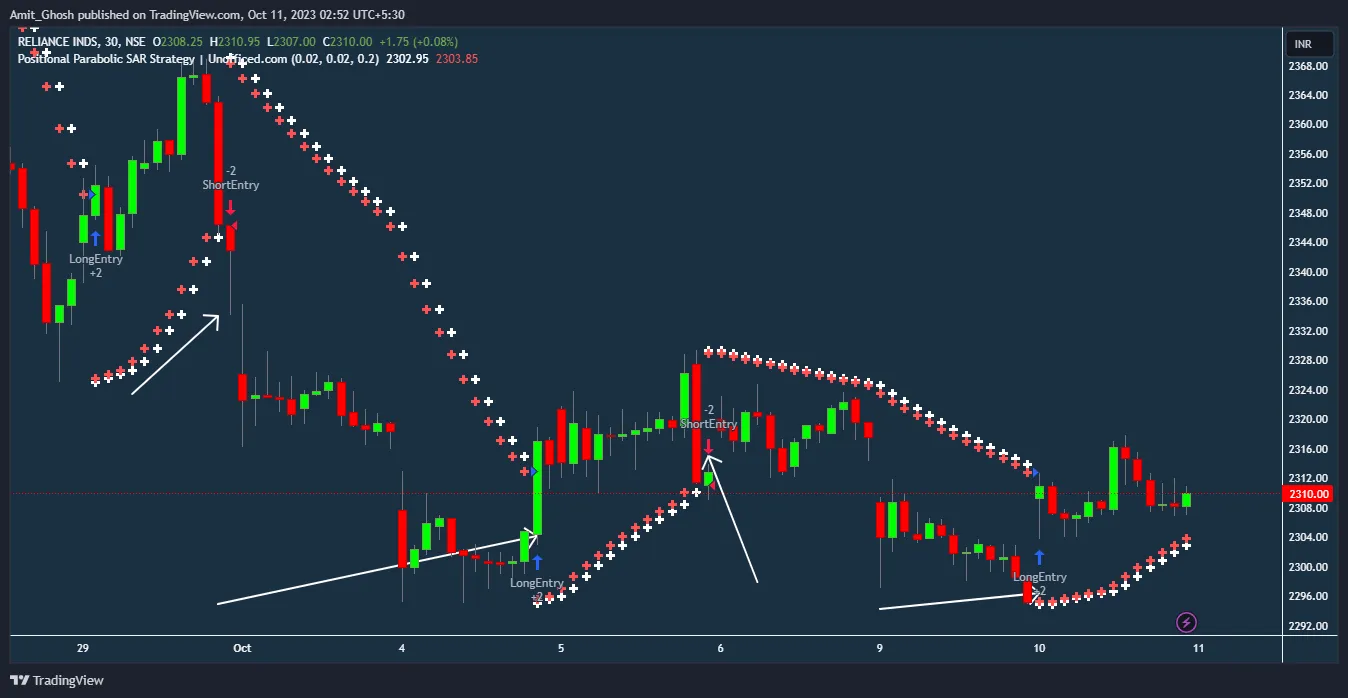
Here is the performance summary corresponding to the trades discussed:
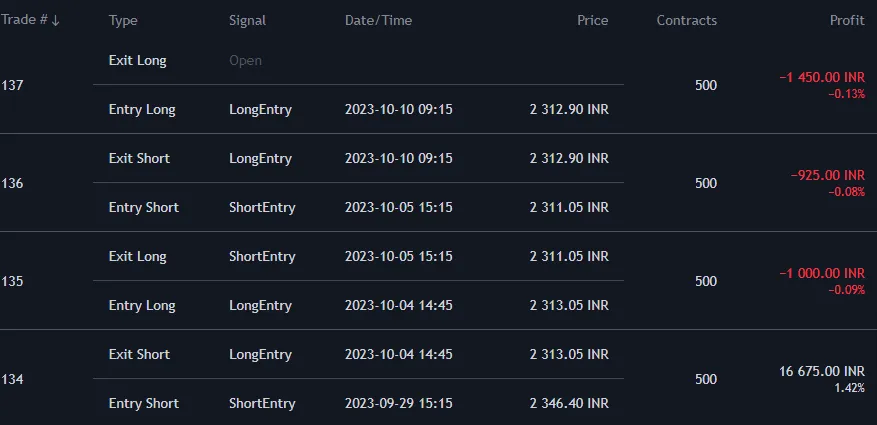
- The initial short trade that caught a strong trend yielded a good profit of around Rs. 16,000.
- The subsequent two trades were caught in consolidation (whipsawed), resulting in small losses.
- The final open trade is also showing a small unrealized loss.
Despite the series of losses, the net result is a profit. This is the classic signature of a trend-following system: one large, successful trade can generate enough profit to cover the losses from many smaller, unsuccessful trades. The goal is to “cut your losses short and let your profits run,” a principle the PSAR enforces mechanically.
The Reliance example was chosen specifically because it demonstrates all the critical scenarios a trader will face with this strategy: strong trends, painful whipsaws, uncomfortable entries, and the psychological battle between fear and discipline. In the next chapter, we will formalize these rules and proceed to build and backtest this strategy in more detail.