Accelerator Indicator
In this chapter, you will learn:
- What the Accelerator Indicator is.
- How to identify market sentiment using the Accelerator Indicator.
- The significance of the zero line in the Accelerator Indicator.
- Techniques for spotting potential trend reversals with the Accelerator Indicator.
- How to interpret the Accelerator Indicator for making trade decisions.
- Adjusting the Accelerator Indicator settings to suit your trading strategy.
Accelerator indicator
The Accelerator (AC) is a technical analysis indicator that highlights the driving force behind an asset’s price movements. It is particularly useful for identifying reversals, showing when an asset’s price shifts from an uptrend to a downtrend, or the other way around.
By analyzing the balance of buyers and sellers in the market, the AC indicator aids in forecasting both the future direction and the momentum of price movements. It demonstrates its highest efficacy in trending markets.
Structure of AC Indicator
Green and Red Bars: Bullish and Bearish Signals

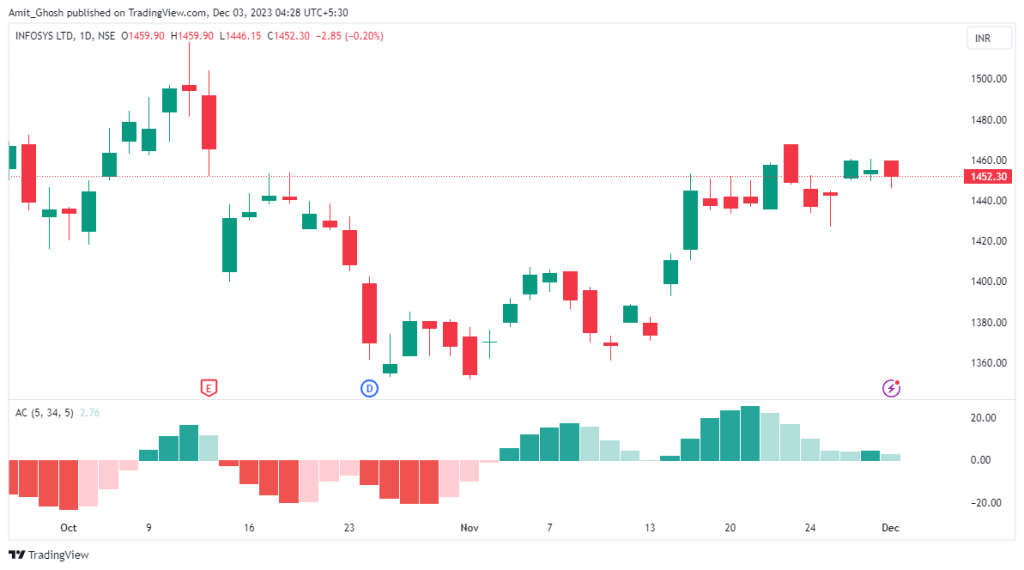
The AC indicator is typically displayed in a box right below the main price chart.
Central to this indicator is a zero line, with green and red bars fluctuating above and below it. This configuration allows for easy visualization of market dynamics, with green bars indicating bullish conditions and red bars signaling bearish conditions.
Interpreting the Zero Line and Market Force
The zero line in the accelerator indicator signifies a balance point where the buying and selling pressures are equal.
- Green bars above this line indicate a bullish market, suggesting that buyers outnumber sellers, thereby driving prices up. The taller the green bar, the stronger the bullish momentum.
- Conversely, red bars below the zero line suggest a bearish market with predominant selling pressure, leading to declining prices.
Identifying Market Reversals with the AC Indicator
The AC indicator is a valuable tool for gauging market sentiment and spotting potential reversals in price direction.

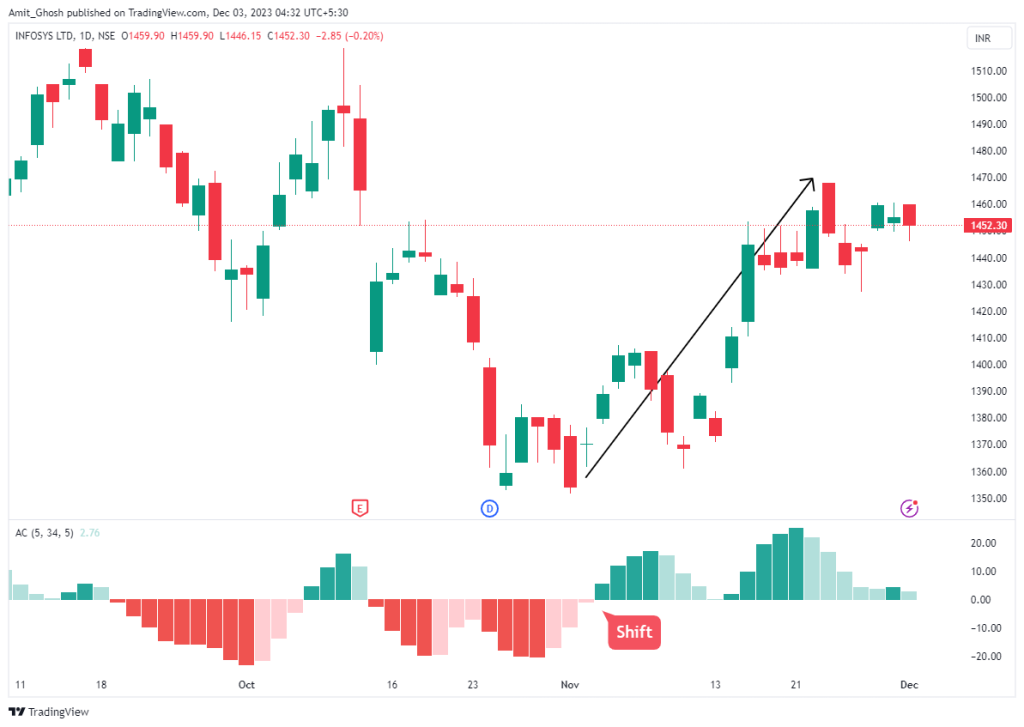
A shift in the bar color from red to green can indicate a possible transition from a downtrend to an uptrend, marking an increase in buying activity.

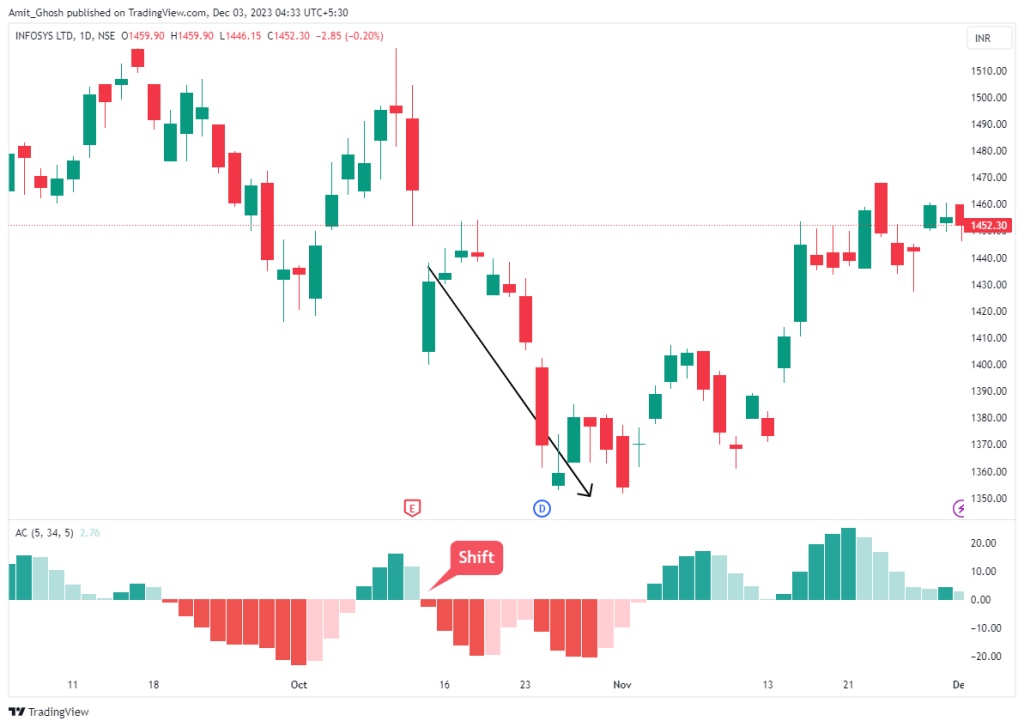
Similarly, a change from green to red bars might signal an uptrend giving way to a downtrend, characterized by increasing selling pressure. Note – Although the price tried to move upwards after the signal of indicator, it eventually went downwards showing that there is a really a shift in sentiment as shown by the indicator!
Confirmation of Trend Reversals
Before making a trade decision based on the AC indicator, it’s recommended to wait for the formation of at least two consecutive bars of the same color. This confirmation strategy helps in ensuring the establishment of a new trend, reducing the likelihood of false signals.
For instance,
- In seeking a buy signal, wait for two successive green bars above the zero line;
- for a sell signal, look for two consecutive red bars below the zero line.
Conclusion
So far you have learned that –
- The Accelerator Oscillator (AC) is an indicator used in technical analysis to reveal the driving force behind the movements in an asset’s price.
- The AC indicator is particularly useful in identifying trend reversals, signaling when an asset’s price shifts from an uptrend to a downtrend, or vice versa.
- Central to the AC indicator is the zero line, which runs horizontally across the chart. This line represents a balance point where the number of traders buying and selling an asset is equal.
- Green bars on the AC indicator signify a bullish market condition, indicating that buyers outnumber sellers and that prices are likely to rise.
- A green bar appearing above the zero line is interpreted as a buy signal. The taller the green bar, the stronger the momentum or driving force behind the rising prices.
- Conversely, red bars represent a bearish market condition, suggesting that sellers are dominating and prices are likely to fall.
- A red bar emerging below the zero line acts as a sell signal. The lower the red bar, the more significant the momentum or driving force behind the falling prices.
- To confirm the emergence of a new trend, traders often look for the formation of at least two bars of the same color (either green or red). This consecutive pattern helps in confirming the establishment of a new trend direction.

