Scalping with Bollinger Bands

This case study demonstrates a series of scalping trades using Bollinger Bands on a short-term chart. The primary techniques illustrated are the Stop-and-Reverse (SAR) and entries based on Doji candlestick patterns. This is a fast-paced style of trading that requires active management from candle to candle.
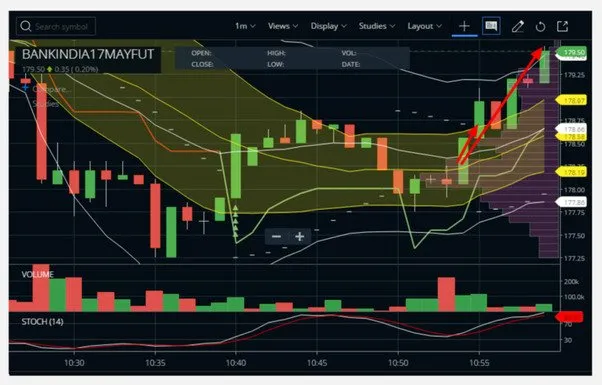
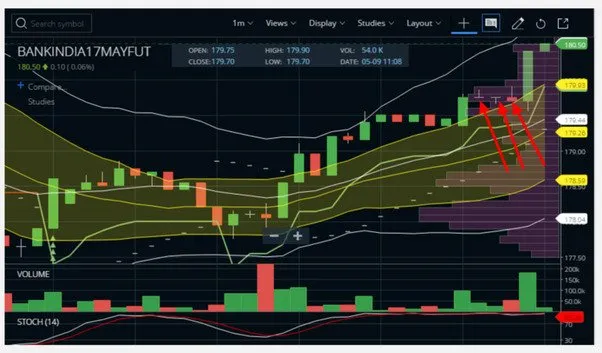
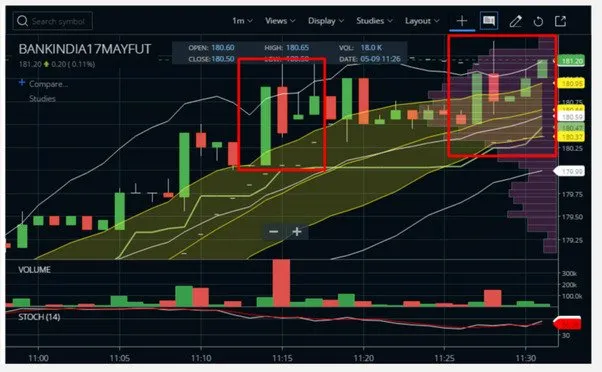
Initial Long Trade and Trailing Stop
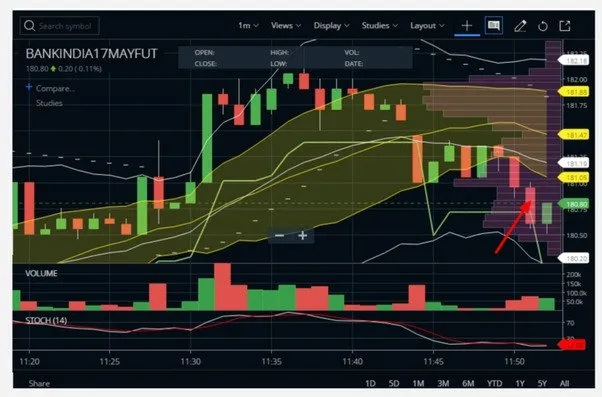
The initial setup involved a long trade where the first two targets were successfully met. The third and final portion of the position was managed with a trailing stop-loss (TSL) set at the median Bollinger Band.
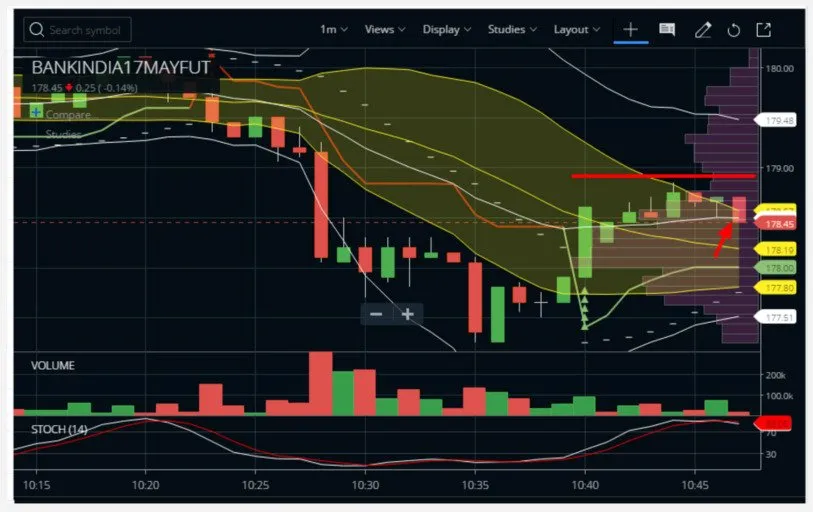
The trade reversed, and my trailing stop-loss at the median band was triggered. While the overall trade was profitable, the triggering of the stop-loss immediately presented a new opportunity.
First Stop-and-Reverse (SAR) Trade
In advanced Bollinger Band trading, a stop-loss can also be an entry signal for a trade in the opposite direction. This is known as a Stop-and-Reverse (SAR) setup. When my trailing stop-loss on the long position was hit, it signaled a reversal. I immediately initiated a short trade. This strategy allows a trader to profit from volatility by capturing moves in both directions.
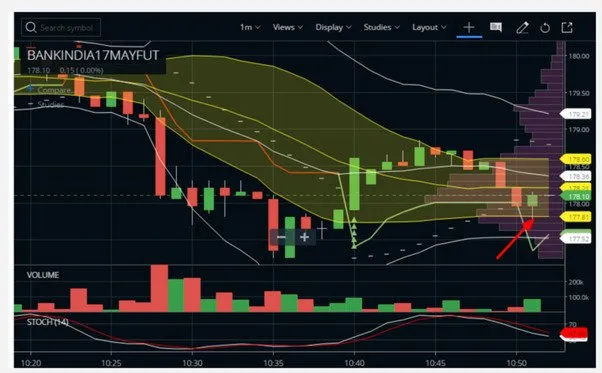
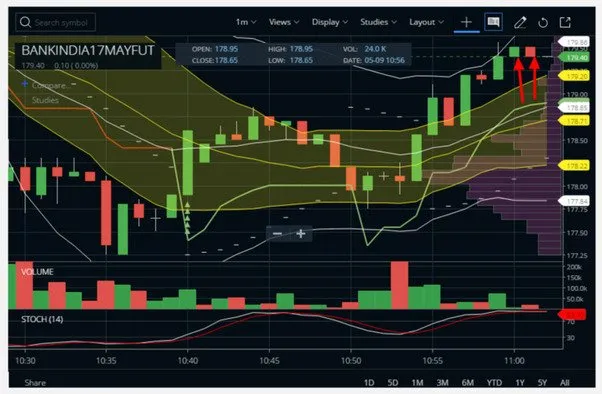
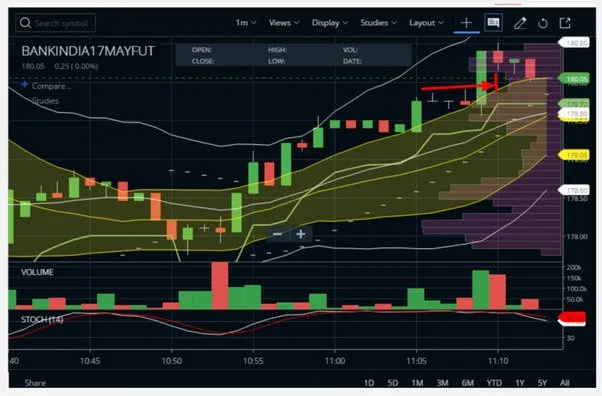
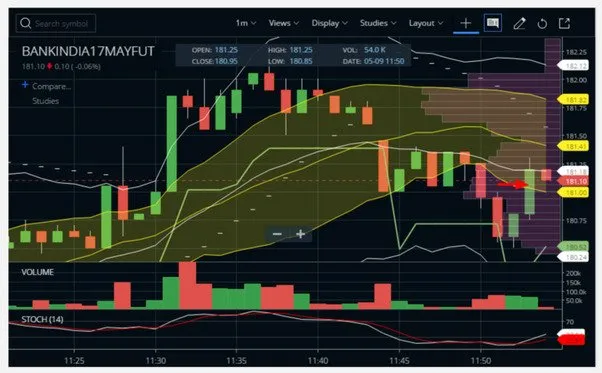
Doji Formation and Trade Exit
The short trade progressed, but soon a Doji candlestick pattern formed. A Doji signals indecision in the market and warns that the current momentum may be fading. Acting on this signal, I exited the short trade with a small profit, just above the breakeven point.
The Doji Breakout Strategy
A Doji itself signals indecision. The subsequent price action is what provides the trading signal. Here is the specific strategy I use for a Doji breakout:
- Wait for a Doji to form, especially one that persists for several bars without significant wicks (tails).
- Identify the confirmation candle, which is the candle that forms a spike immediately following the Doji.
- Place a buy order at the high of the confirmation candle and a sell order at its low.
- When one order is triggered, cancel the other. This lets the market’s momentum dictate the direction of the trade.
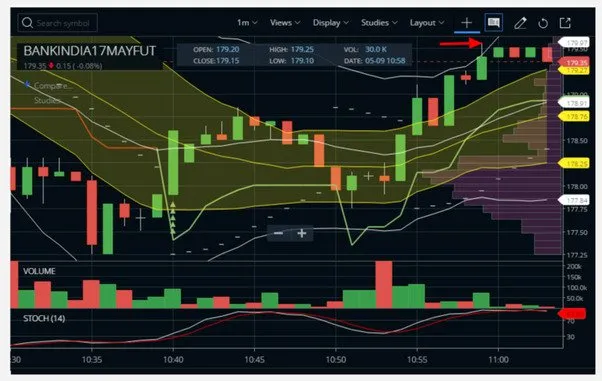
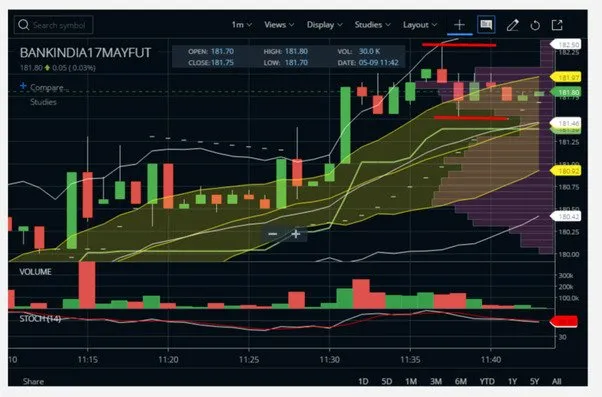
With this setup, I initiated a trade at the median Bollinger Band with two lots, setting two potential exit targets:
- Target 1: The upper band of the 1-standard deviation (1 SD) Bollinger Band.
- Target 2: The upper band of the 2-standard deviation (2 SD) Bollinger Band.
The original stop-loss was placed at the low of the spike on the preceding candle.
The trade successfully hit the first target. I then trailed the stop-loss to the first target’s level to secure profit while aiming for the second target. The second target was also achieved.
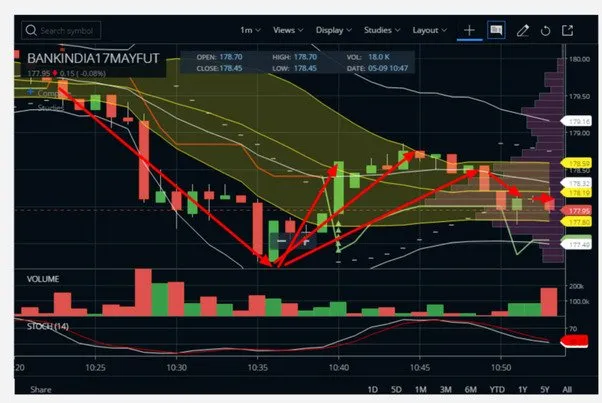
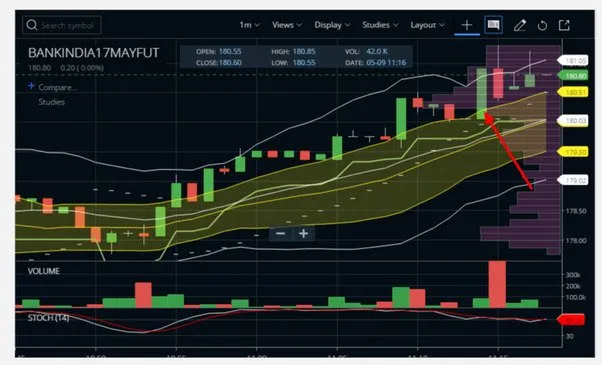
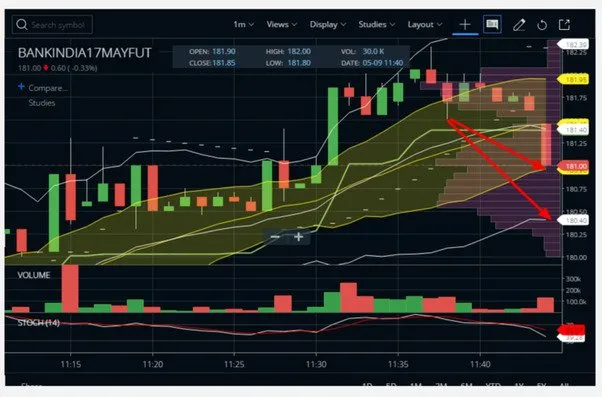
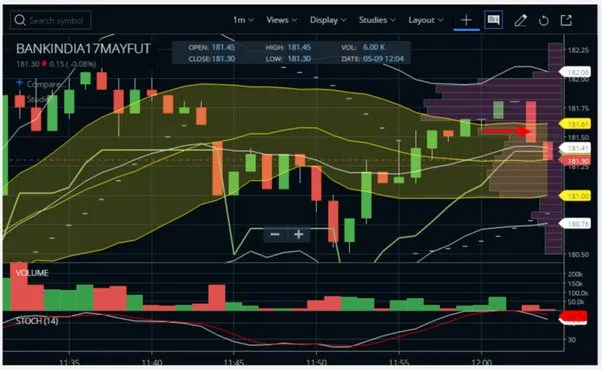
Second SAR and Final Trade Sequence
Eventually, the trailing stop-loss on the long position was hit, triggering another SAR setup. I immediately entered a short position with the stop-loss set at the price action level where the reversal occurred.
This stop-loss was ultimately hit, and I was out of the trade.
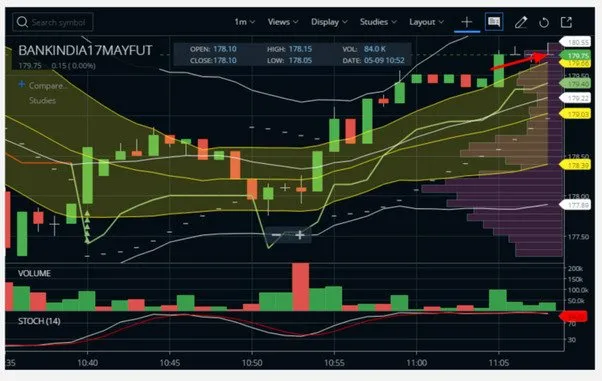
The market then presented another Doji setup.
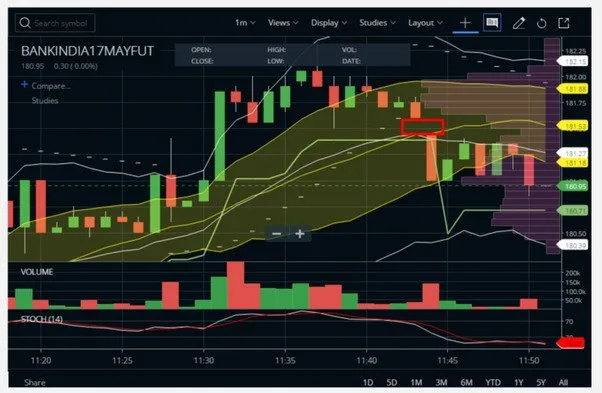
Here is the play-by-play for this sequence:
- A Doji forms, and I close the previous trade for a 0.25 point profit.
- A new buy order is placed based on the Doji breakout rules.
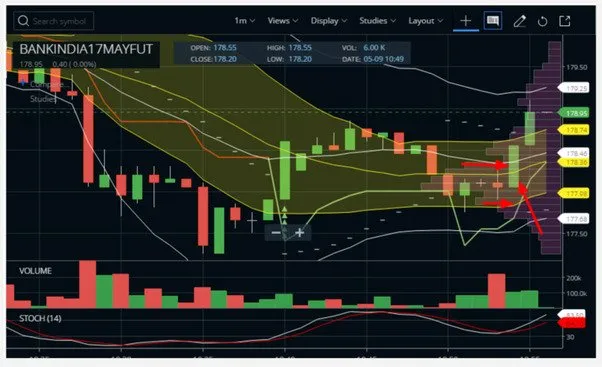
- Instead of placing the stop-loss strictly by the candle’s low at 179.5, I incorporate Volume Profile Analysis (VPA). VPA suggested a stronger support level near 180.
To further refine the stop-loss, I averaged three potential support levels (180.14, 179.86, etc.) to get a mean around 180. Recognizing that round numbers are psychological barriers, I adjusted the stop slightly to 180.05, just above the psychological level.
As the trade moved in my favor, I trailed the stop-loss aggressively, first to 180.35 (low of the candle)…
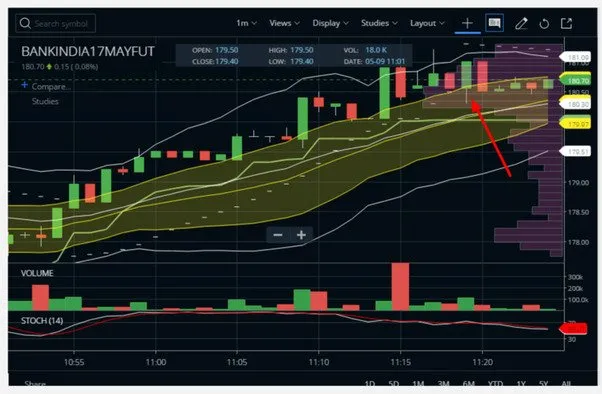
…and then to 180.45 (low of the candle at 11:23). I finally closed the position at 181.05.
What this trade teaches
This complex sequence of trades illustrates how scalping is not a single strategy but a dynamic process of reading and reacting to price action on a candle-by-candle basis. It combines several core Entropy concepts:
- Bollinger Bands: Used not just for overbought/oversold signals, but for identifying the trend (median band), setting targets (outer bands), and managing risk.
- Doji Patterns: Used as a high-probability signal for a potential reversal or pause in momentum, providing a low-risk entry point.
- Stop and Reverse (SAR): A disciplined method for flipping a position when a stop-loss is hit, ensuring the trader is always positioned in the direction of the market’s immediate momentum.
- Price Action & VPA: Used to refine entries and exits, moving beyond purely mechanical signals to incorporate psychological levels and volume-based support/resistance.
Takeaway
Effective scalping requires more than just one setup. It involves blending multiple techniques like price action, candlestick patterns (Dojis), and indicator-based rules (Bollinger Bands) to adapt quickly to changing market dynamics. The SAR technique is a powerful tool for staying on the right side of short-term volatility.