
Downloading Entropy Alpha Trigger Points

The Goal: Sourcing Backtest Data
Before backtesting any trading strategy, we need reliable historical data. This lesson shows how to download the trigger points generated by the Entropy Alpha scanner. These triggers are the specific stocks and times identified by the strategy as potential mean-reversion opportunities. We will use this data as the foundation for our Python backtest in the following lessons.
“Why do you think unsuccessful traders are obsessed with market analysis? They crave the sense of certainty that analysis appears to give them. Although few would admit it, the truth is that the typical trader wants to be right on every single trade. He is desperately trying to create certainty where it just doesn’t exist.”
– Mark Douglas
This quote is the philosophical core of Entropy. We do not seek certainty. We operate on probabilities derived from the statistical behaviour of asset prices, specifically their tendency to follow a normal distribution.
What is the Entropy Alpha Strategy?
The Entropy Alpha Strategy is a mean-reversion system developed at Unofficed. It uses Bollinger Bands as its primary tool to identify statistically significant price deviations from the mean. The core idea is that prices that stretch far from their average are likely to revert back towards it. The strategy aims to capture this reversion.
It identifies potential trades on NSE F&O stocks. While the core logic is based on statistical probabilities, it is augmented by machine learning techniques (regression and k-means clustering) to refine the selection of high-probability setups from historical trade data.
The Entropy Alpha Scanner
The scanner is the engine that generates our trading signals. It runs throughout the trading day, analysing F&O stocks and identifying candidates that meet the stringent criteria of the Entropy Alpha setup. The output is a simple list of stock symbols and the time they were triggered.
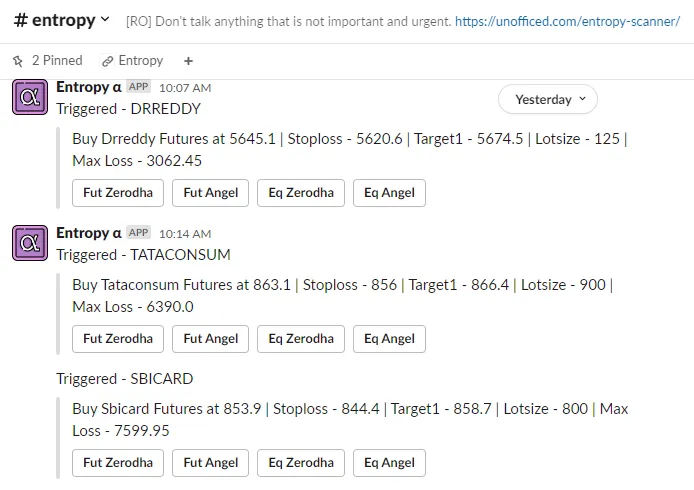
At the end of each day, these triggers are consolidated and made available for analysis and backtesting.
Accessing the Trigger Data
There are two primary ways to access the trigger data: a live dashboard for the latest signals and a downloadable CSV file for historical backtesting.
1. Live Entropy Alpha Dashboard
This embedded Google Sheet shows the most recent triggers generated by the scanner. It is updated at the end of each trading day.
2. Historical Data CSV File
For systematic backtesting, we need a machine-readable history of triggers. This is provided in a simple CSV (Comma-Separated Values) file named entropy_data.csv. This is the file we will use in our Python scripts.
Here is a preview of its contents:
	Triggered at	Stocks (new stocks are highlighted)
0	Tue Apr 25 2023, 3:18 pm	PERSISTENT
1	Tue Apr 25 2023, 2:47 pm	INDIAMART
2	Tue Apr 25 2023, 10:18 am	RECLTD
3	Tue Apr 25 2023, 10:10 am	IBULHSGFIN, BRITANNIA
4	Tue Apr 25 2023, 10:02 am	BRITANNIA
5	Mon Apr 24 2023, 10:16 am	HEROMOTOCO
6	Fri Apr 21 2023, 10:07 am	APOLLOTYRE
7	Fri Apr 21 2023, 9:58 am	ASIANPAINT
8	Thu Apr 20 2023, 3:21 pm	TATACONSUM
9	Thu Apr 20 2023, 2:16 pm	BAJAJ-AUTO
10	Thu Apr 20 2023, 12:49 pm	CUB
11	Thu Apr 20 2023, 10:02 am	ICICIBANK
12	Wed Apr 19 2023, 10:29 am	COROMANDEL
13	Wed Apr 19 2023, 10:06 am	TATASTEEL
14	Wed Apr 19 2023, 9:16 am	COFORGE
15	Tue Apr 18 2023, 1:31 pm	BANDHANBNK
16	Tue Apr 18 2023, 10:13 am	WHIRLPOOL, GODREJPROP, PEL
17 Tue Apr 18 2023, 10:02 am GODREJPROP, PELData Structure
The CSV file has a straightforward structure that we need to parse in our backtesting script.
| Column | Description | Example |
|---|---|---|
| Triggered at | The date and time the signal was generated. This is the entry point for our backtest. | Tue Apr 25 2023, 3:18 pm |
| Stocks | The NSE symbol of the stock(s) that triggered. Multiple stocks can trigger at the same time, separated by commas. | IBULHSGFIN, BRITANNIA |
Next Steps
With the entropy_data.csv file downloaded, you now have the raw material for the backtest. The subsequent lessons in this module will walk you through writing a Python script to:
- Parse this CSV file.
- Download historical price data for each triggered stock using an API like KiteConnect.
- Simulate trades based on the strategy’s entry and exit rules.
- Calculate and analyse the performance metrics of the strategy.