Gail Futures Trade Using Bollinger Bands

Gail Futures: The Setup
This case study examines a short trade in GAIL futures using a specific Bollinger Band pattern I call the 3BB strategy. Because GAIL is a high-beta stock, its price action on lower timeframes is often too noisy to provide clear signals. Switching to a higher timeframe helps filter this noise and reveal more reliable trends suitable for trading.
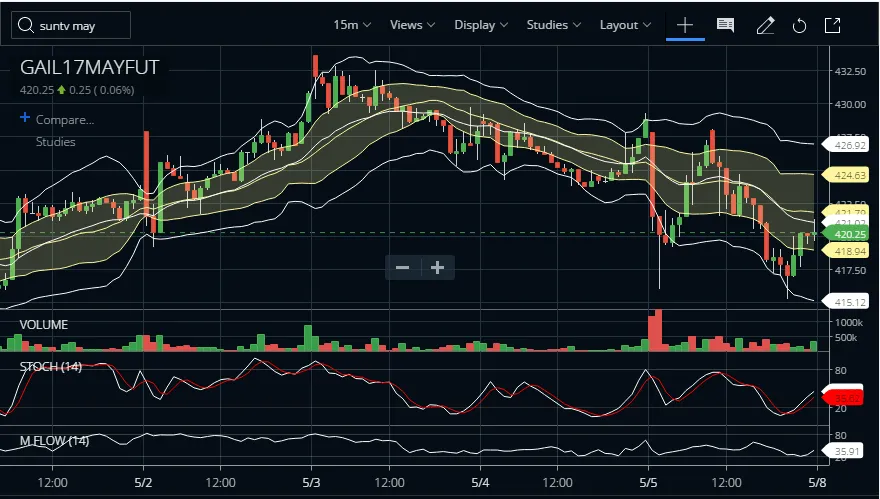
The chart above illustrates the difference. The top pane shows a higher timeframe where trends are discernible, while the bottom pane shows a lower timeframe where the price action is choppy and erratic, making it difficult to trade.
The 3BB Sell Signal
The following chart shows a specific sell signal that developed in GAIL futures, which aligns with the 3BB strategy rules for initiating a short position.
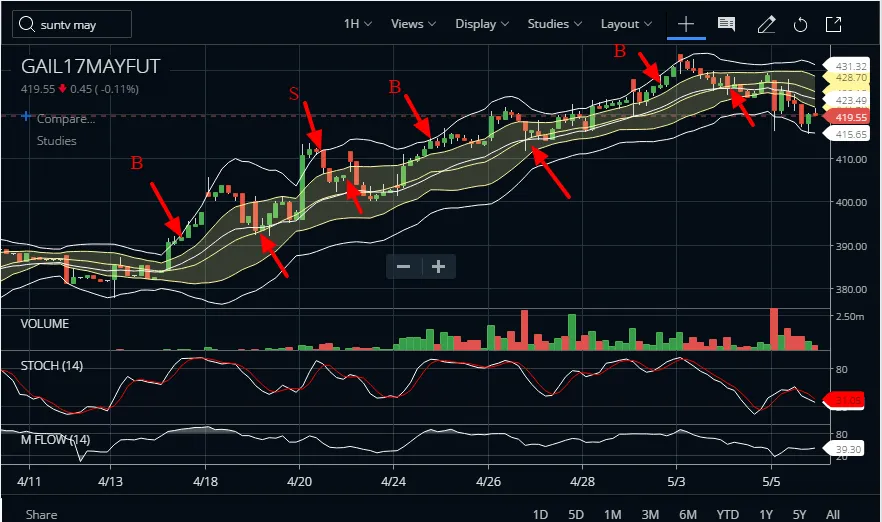
Entry Rules for a Short Trade
To identify a high-probability short entry, the following conditions must be met in sequence:
- A red candle must close outside the lower 1 Standard Deviation (SD) Bollinger Band.
- The next candle must also be red, opening and closing below the lower 1 SD Bollinger Band.
- The entry for the short trade is at the close of this second red candle, as the third candle begins to form.
Trade Management and Reversal
Once the trade is entered, the position is managed as follows:
- Profit Target: The trade is closed when a candle touches the median (the 20-period moving average) of the Bollinger Bands.
- Stop-Loss / Reversal: If, after entry, the third candle closes as a green candle, it signals a potential reversal. To manage this, place two buy-stop orders at the high of that third (green) candle. If triggered, this not only exits the short position for a minimal loss but also opens a long position to capture the reversal.
What This Trade Teaches
Takeaway
Trading high-beta stocks like GAIL requires a structured approach to filter out market noise. The 3BB strategy provides a clear, rules-based method for entering momentum trades using Bollinger Bands and, crucially, includes a pre-defined plan for managing the trade if it moves against the initial position.