Entropy Alpha Strategy Scanner

What is the Entropy Alpha Strategy Scanner?
The Entropy Alpha Strategy Scanner is a real-time tool designed to identify high-probability long entry setups based on the Entropy Alpha Strategy. This strategy is a quantitative, long-only, mean-reversion approach applied primarily to the universe of Indian F&O stocks.
Unlike the Entropy 3BB Strategy Scanner, which focuses on short setups and uses a two-step process (watchlist and trigger), the Alpha scanner operates differently:
- Long-Only Setups: It exclusively identifies potential buying opportunities, making it a tool for bullish or range-bound market conditions where stocks are expected to revert to their mean.
- Direct Trigger Scanner: It does not generate a preliminary watchlist. Instead, it posts an alert directly to the Unofficed forum the moment a trade setup is triggered according to the strategy’s strict criteria. This provides an immediate, actionable signal.
How the Scanner Works: Filter Criteria
The scanner’s core function is to sift through hundreds of stocks in real-time to find the few that meet the precise conditions of the Entropy Alpha model. While the exact algorithm incorporates a machine learning layer and remains confidential, the filtering criteria are conceptually based on these principles:
- Universe Selection: The scanner focuses on stocks listed in the Futures & Options (F&O) segment of the National Stock Exchange (NSE). This ensures adequate liquidity and the availability of derivatives for hedging or leveraged positions.
- Volatility and Liquidity Filter: Stocks must exhibit a minimum level of daily volatility and trading volume. This is crucial for mean-reversion strategies, which capitalize on price swings. The scanner implicitly filters out illiquid or stagnant stocks where such opportunities are rare.
- The Core “Alpha” Trigger: The trigger condition is a sophisticated evolution of a classic Bollinger Band setup. It identifies stocks where the price has experienced a significant downward move, pushing it to or below the lower Bollinger Band. However, the “Alpha” component adds several layers of quantitative validation:
- It analyzes the velocity and momentum of the price drop.
- It assesses the expansion of the Bollinger Bands to gauge volatility.
- A proprietary machine learning model evaluates the price action to distinguish a genuine oversold bounce candidate from a stock entering a prolonged downtrend (a “value trap”).
Only when all these conditions align does the scanner fire an alert, signifying a statistically favourable entry point for a long trade.
Understanding the Scanner Output
Alerts from the Entropy Alpha Scanner are posted live in the Unofficed forum. Each alert is concise and provides the necessary information to assess the trade.
Here is an example of a typical alert:
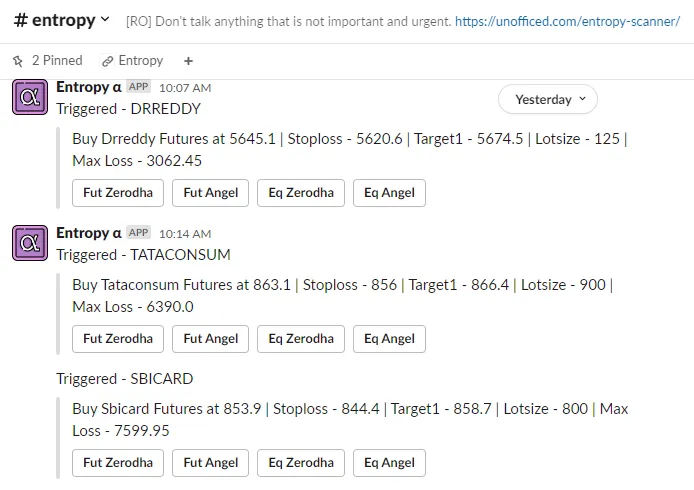
The key components of the alert are:
- Stock Symbol: The NSE symbol of the stock, e.g.,
BAJAJFINSV. - Trade Direction: Always “Long” for this scanner.
- Trigger Price: The exact price at which the entry condition was met, e.g., “Triggered at 1500.0”.
- Timestamp: The time of the alert, allowing traders to reference the exact candle on their charting platform.
To access these live alerts, you need to be a member of the Unofficed Live Chat Forum. The scanner is provided free of charge.
How to Use the Scanner Alerts
The alerts are real-time and actionable. Here’s a typical workflow for a trader using the scanner:
- Monitor the Forum: Keep the Unofficed forum’s #scanner channel open during market hours.
- Receive Alert: When an alert appears, quickly pull up the chart for the specified stock.
- Execute the Trade: The strategy dictates entering a long position at or near the trigger price. This can be done with a market order for immediate entry or a limit order if the price is slightly away from the trigger.
- Apply Risk Management: This is the most critical step. The scanner provides an entry, not a complete trade plan. The trader must calculate position size based on their risk tolerance and place a stop-loss. A common approach is to place the stop-loss below the low of the trigger candle or use a multiple of the ATR.
- Define the Exit: The primary target for a mean-reversion trade is typically the 20-period moving average. Traders may exit the full position there or scale out, letting a portion run with a trailing stop-loss.
Synergy with the 3BB Strategy
The Entropy Alpha System is designed to seamlessly complement the 3BB Strategy. While both are high-performance systems, they are built to capture alpha from different market dynamics:
- Entropy Alpha: Long-only, mean-reversion. Performs well when stocks are oscillating within a range or pulling back in a larger uptrend.
- 3BB Strategy: Primarily short-only, momentum/breakdown. Performs well in bearish trends or when stocks break down from consolidation.
By trading both strategies, a trader can build a more robust, “all-weather” portfolio. The two strategies are largely uncorrelated. This means that when market conditions are unfavourable for one, they are often favourable for the other. Combining them helps to smooth the equity curve and reduce the portfolio’s overall volatility and drawdown, a concept related to reducing the standard deviation of returns.
Daily Trade Log and Performance
For full transparency, a log of all trades triggered by the scanner is updated at the end of each trading day. This allows traders to analyze the strategy’s performance over time. You can view the live, updated trade log below.
For more detailed analytics and visualizations, visit the Entropy Alpha Dashboard.