BRS Bollinger Bands Trading Strategy

The Bollinger Ride Strategy, or BRS, is the first formal trading strategy taught in the Entropy course. It was developed by Amit Ghosh in early 2018 during a discussion on Bollinger Bands and probability distributions in the Unofficed trading forum. The strategy is designed to enter a confirmed directional move with a clearly defined, tight risk profile, aiming to capture the momentum that follows a breakout from a volatility-contracted state.
Chart setup
The BRS and its variations rely on a specific dual-Bollinger Band setup. The goal is to have one band for slower, more reliable mean calculations and another for faster-reacting breakout signals. We apply two separate Bollinger Band indicators to the chart.
The first is the Outer Band, which will use a 2-standard-deviation channel and an Exponential Moving Average (EMA) to react more quickly to price changes.
The second is the Inner Band, which uses a 1-standard-deviation channel and a Simple Moving Average (SMA) to provide a more stable, less erratic median line, especially during periods of high volatility.
| Parameter | Outer Band (2-SD) | Inner Band (1-SD) |
|---|---|---|
| Period | 20 | 20 |
| Standard Deviations | 2 | 1 |
| Moving Average Type | Exponential (EMA) | Simple (SMA) |
| Channel Fill | Yes | No |
The long entry rule
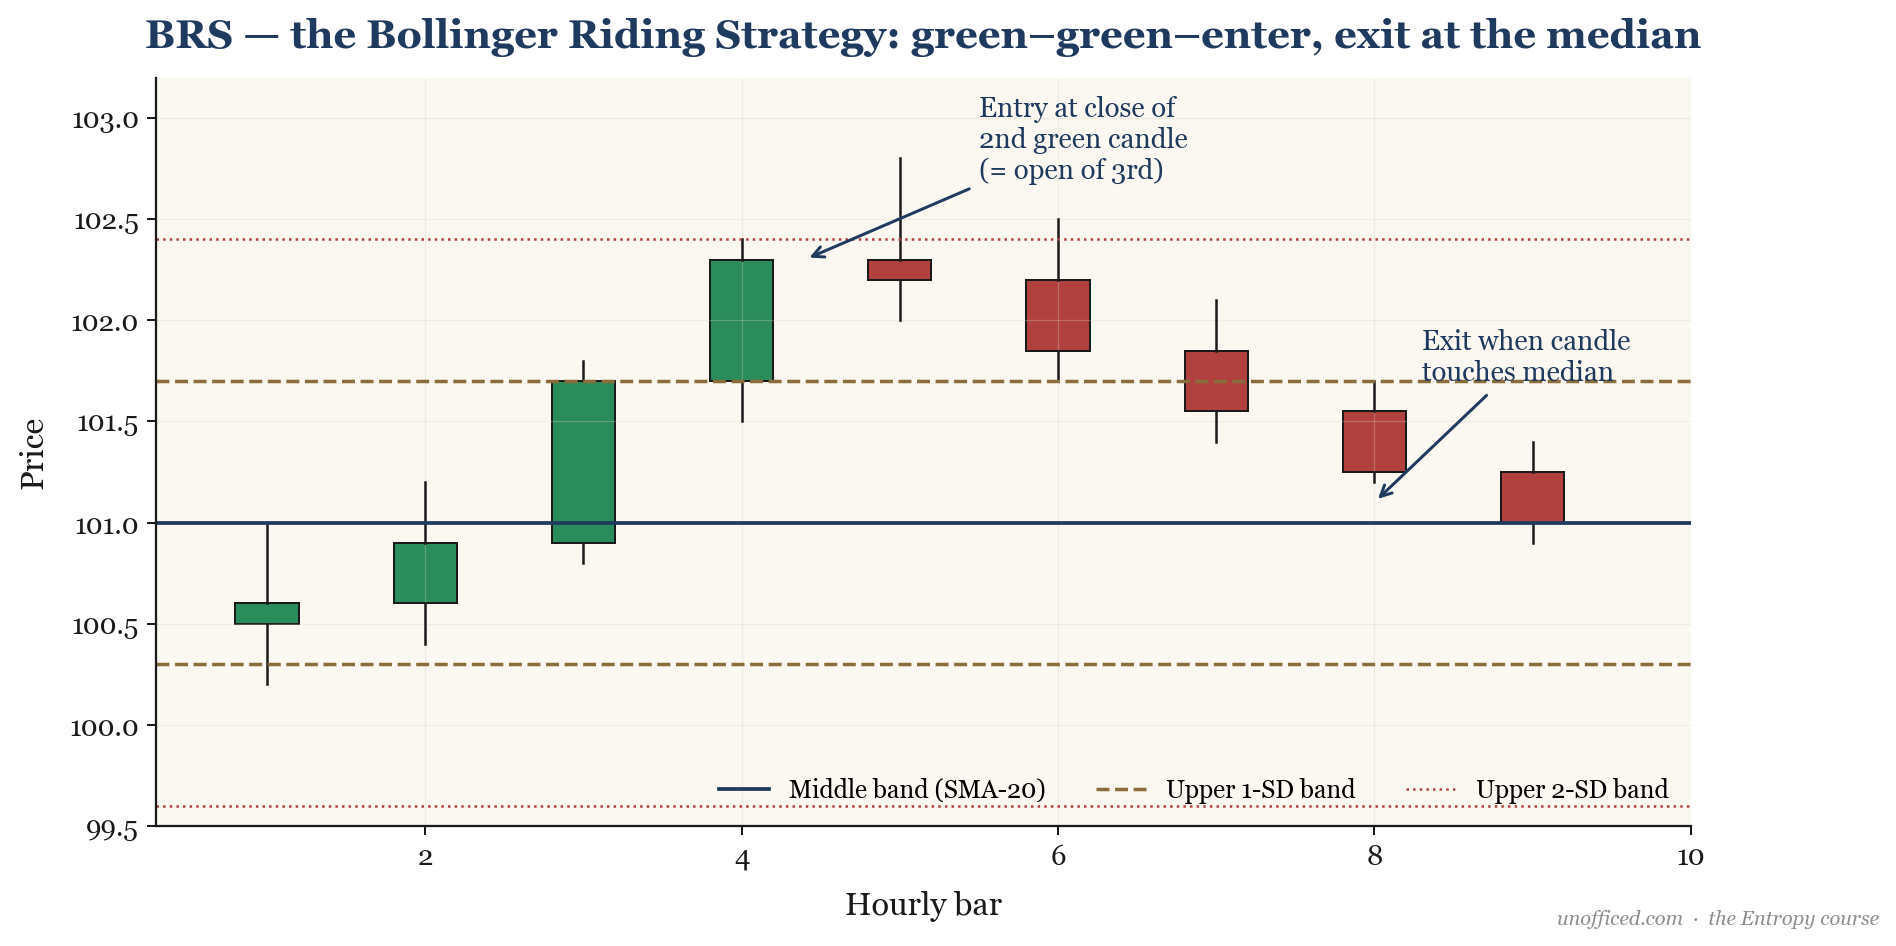
The BRS long trade is a simple, four-step pattern designed to confirm that price is not just touching a band but actively “walking” or “riding” it. The rules are precise:
- Find a green candle whose close is outside (above) the upper 1-SD band. This is the setup candle.
- The very next candle must also be green, and it must open and close above the upper 1-SD band. This is the confirmation candle.
- Enter a long position at the close of this second green candle (which is the same as the open of the third candle).
- Place an exit order for when price action subsequently touches the median (20-period SMA) of the 1-SD Bollinger Band.
The rule for a short entry is the mirror opposite: find a red candle closing below the lower 1-SD band, followed by a second red candle that opens and closes below it. Enter short at the close of the second candle and exit when price touches the median band.
A worked example
Let’s examine a BRS trade on a synthetic instrument designed to mimic NIFTY price action. The chart below shows a clear BRS long setup forming.
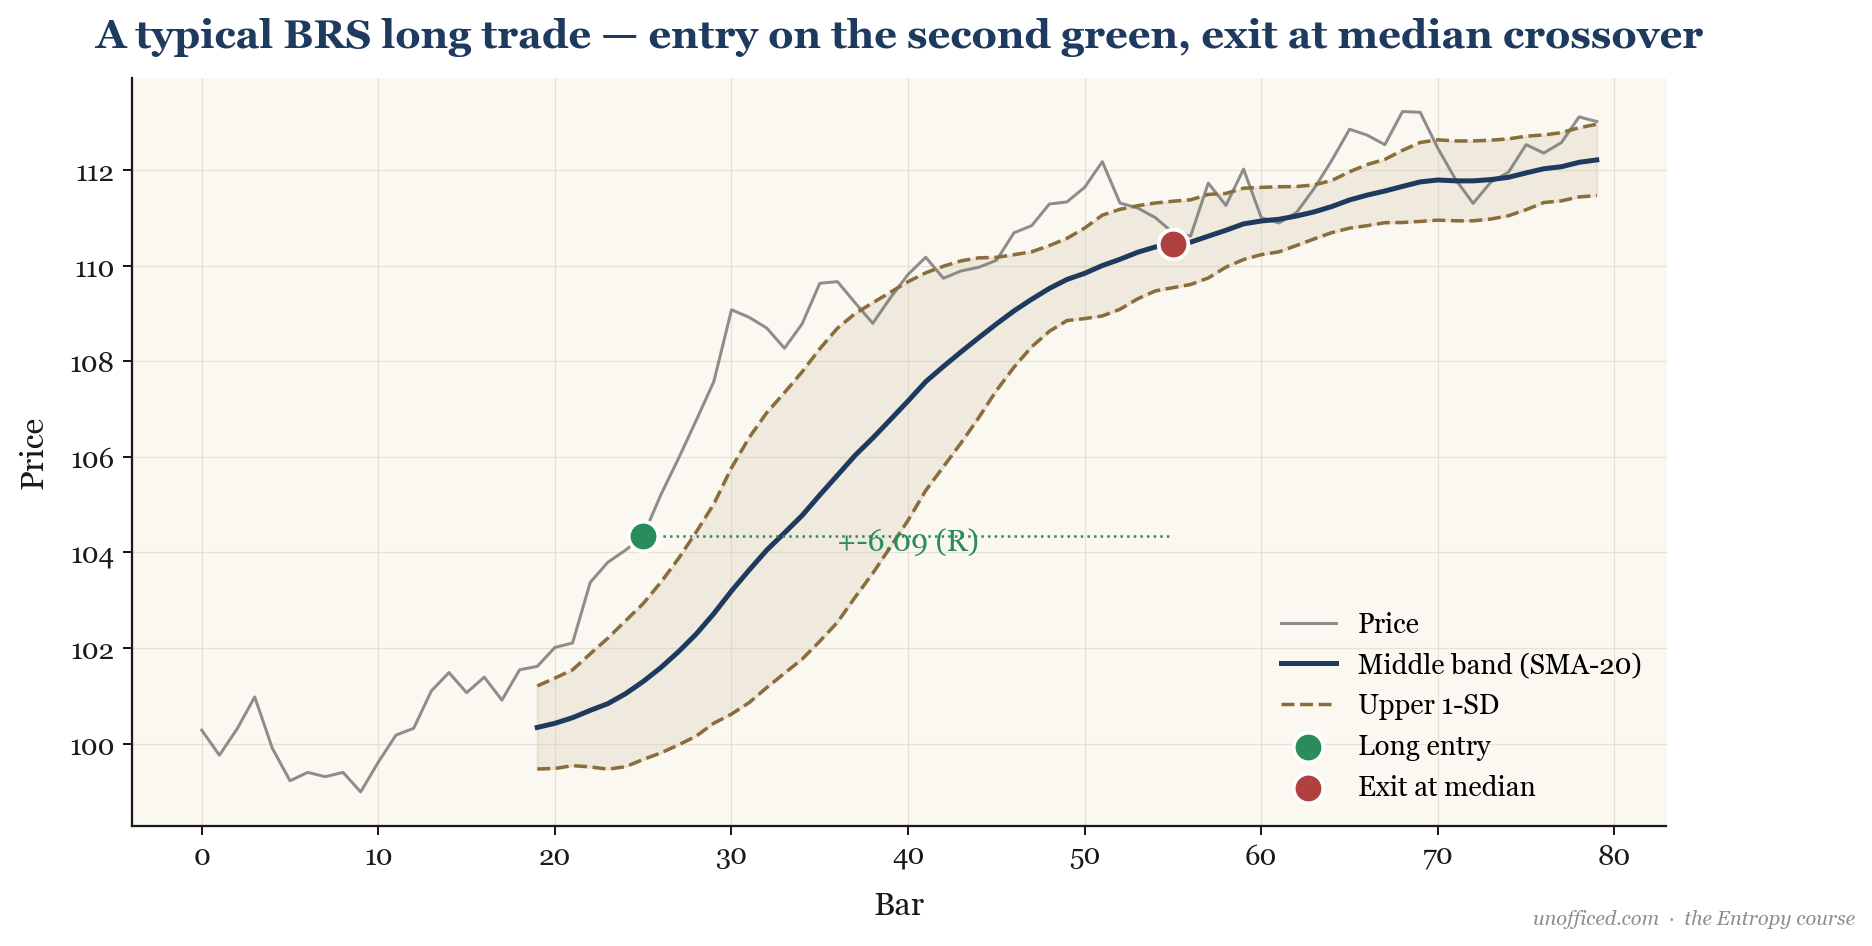
The setup candle closes above the 1-SD line. The next candle opens and closes entirely above the 1-SD line, confirming the trend’s strength. We enter long at the close of this confirmation candle, at a price of approximately 102.3. The trade is held until a later candle’s wick touches the median SMA line at 103.5. The trade realised a profit of 1.2 points.
When BRS fails — the 3BB reentry
No strategy is infallible. A common failure mode for the BRS is when the confirmation candle (the second green candle) is immediately followed by a sharp reversal. This specific pattern, known as the 3BB (Three-Bar Bollinger), offers a systematic way to reverse the position and capture the resulting move back to the mean.
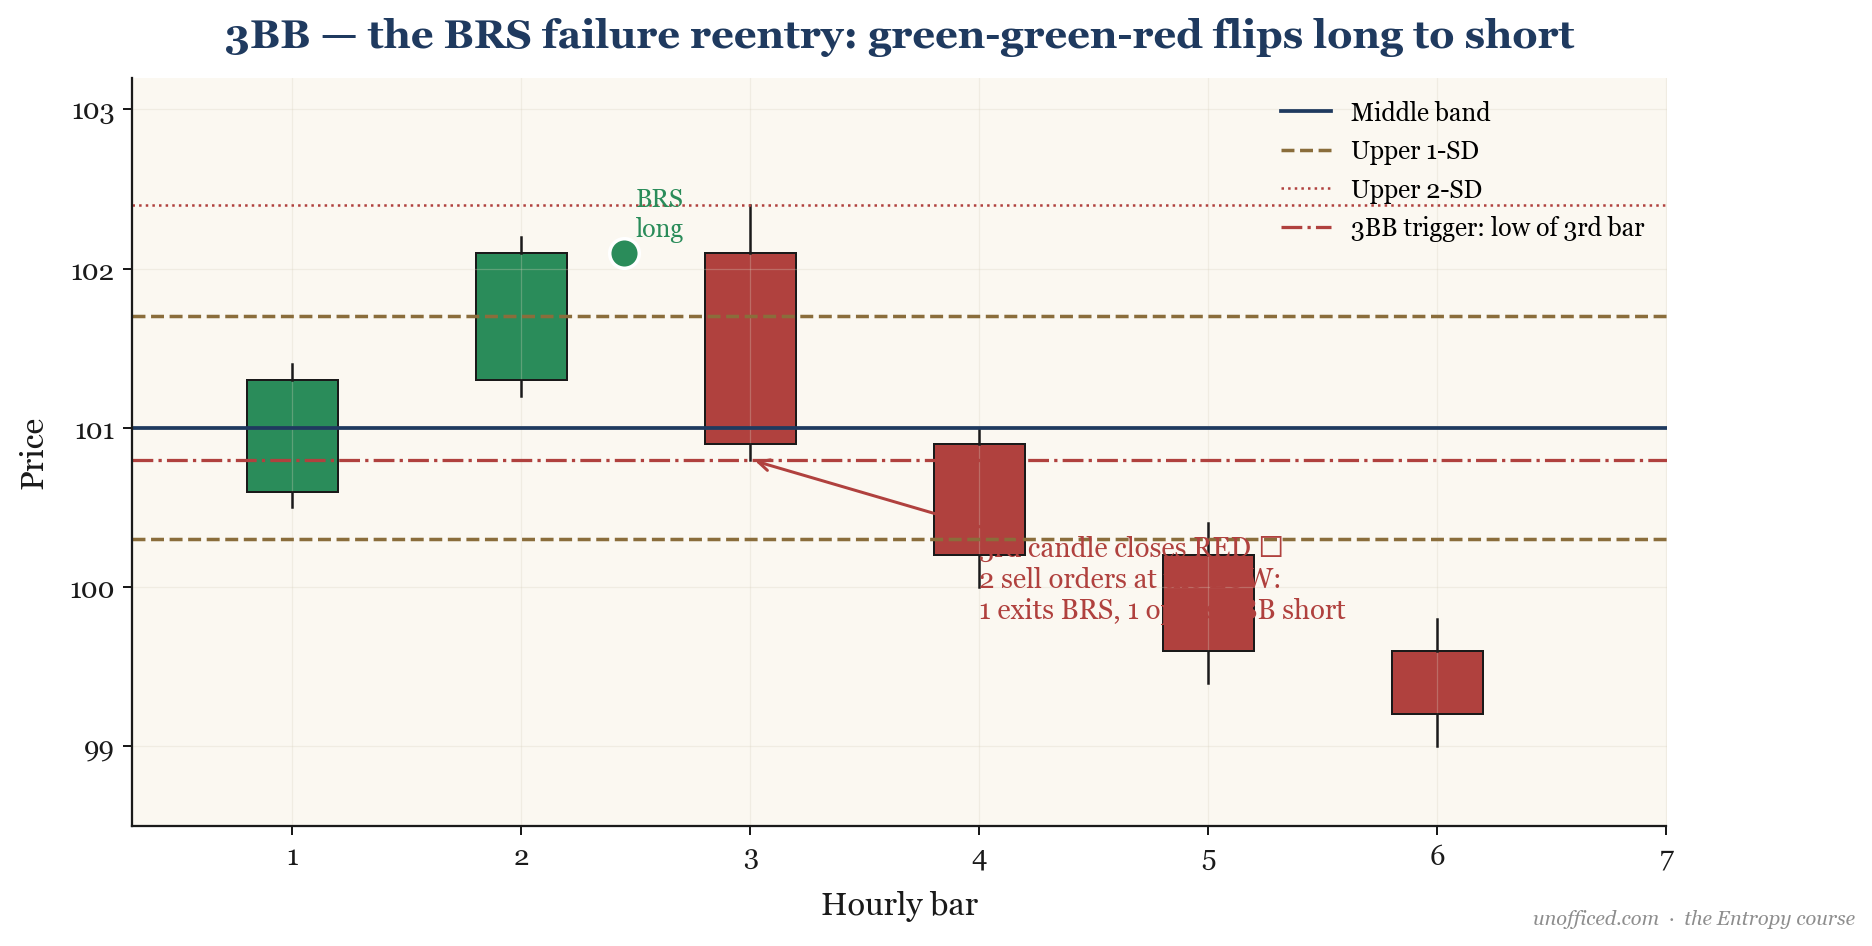
The 3BB rule is as follows:
- You have just entered a BRS long based on the close of the second green candle (bar t+1).
- The next candle (bar t+2) opens but then closes red, moving against your position.
- Immediately place two sell orders at the low of this red candle (bar t+2).
- The first order closes your original BRS long position for a small loss.
- The second order opens a new short position, initiating the 3BB trade.
- The stop-loss for this new 3BB short is placed at the high of the red reversal candle (bar t+2). The take-profit target is the median Bollinger Band.
The signature pattern is a GREEN-GREEN-RED sequence for a long BRS that flips into a 3BB short. The mirror pattern, RED-RED-GREEN, signals a short BRS flipping into a 3BB long. The source material for this strategy claims that once this pattern forms, there is a 98.5% probability of price crossing the median band.
Confirmation conditions for high-confidence 3BB
The highest probability 3BB setups occur under specific conditions related to the dual-band configuration:
- The second candle of the BRS setup (the confirmation candle) should close above the upper 2-SD band.
- The open AND close of that same confirmation candle must fall between the 1-SD and 2-SD bands (i.e., inside the “channel” created by the two upper bands).
Summary
The BRS and 3BB systems provide a rules-based framework for trading breakouts and their immediate failures.
- BRS Strategy: A trend-following strategy that enters on the second confirmation candle riding the 1-SD Bollinger Band.
- Dual Bands: Uses a faster EMA-based 2-SD band for signals and a slower SMA-based 1-SD band for more stable exits.
- Clear Exit: The exit for all BRS and 3BB trades is a touch of the 20-period simple moving average (the median of the 1-SD band).
- 3BB Reentry: A specific rule to reverse a failing BRS trade when a GREEN-GREEN-RED (or RED-RED-GREEN) pattern appears.
- Risk Management: The 3BB trade has a defined stop-loss at the high (for shorts) or low (for longs) of the reversal candle.
While the 3BB provides a way to manage a failed BRS, there are times when the 3BB itself fails. The next lesson introduces the F3BB, a martingale-style escalation to handle this scenario.