Standard Deviation Indicator
In this chapter, you will learn –
- What the CCI (Commodity Channel Index) indicator is and its purpose in trading.
- How the CCI indicates overbought and oversold conditions.
- The method of interpreting CCI readings for trading decisions.
- Adjusting CCI settings and the effects of different settings on trading signals.
- Effective strategies for utilizing the CCI in various market conditions.
The Standard Deviation Indicator
The standard deviation indicator measures recent price movements of an asset to predict future volatility.
- It assists in determining if the asset’s price volatility is likely to increase or decrease.
- This indicator is key in understanding the volatility patterns of the market.
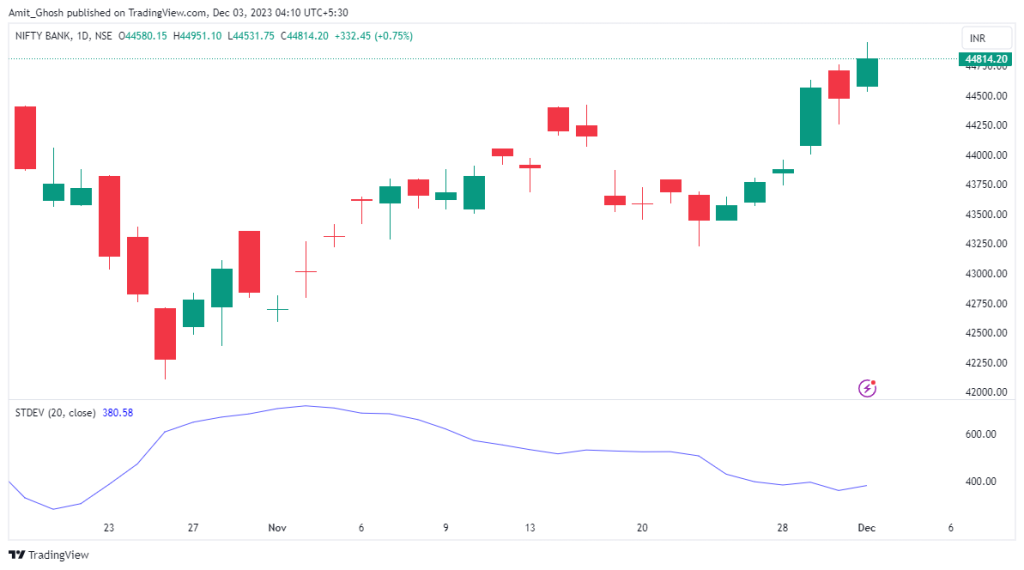
The indicator analyzes current price movements against historical data. Displayed typically as a blue line on charts, it fluctuates to indicate whether past price movements are larger or smaller than current movements.
This visualization helps in assessing the volatility trend of an asset.
High Standard Deviation Scenario
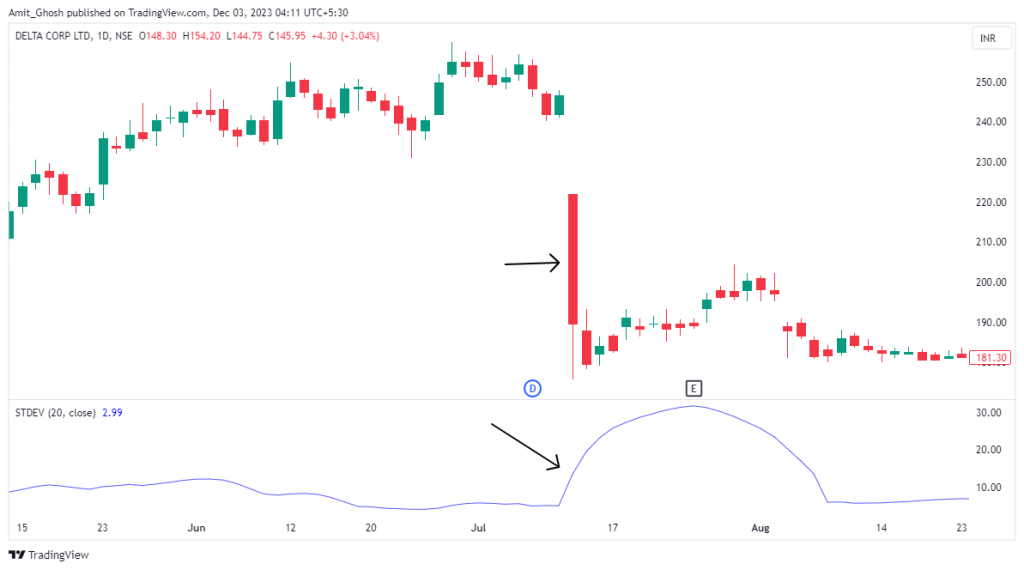
- A high reading on the standard deviation indicator often follows a significant price move.
- In periods where the blue line is high, it’s likely that the asset’s price volatility will decrease soon.
- This phase is characterized by large price changes, as shown in the accompanying chart.
Low Standard Deviation Scenario
- A low standard deviation reading usually indicates a stable price, often seen in ranging markets.
- Extremely low readings might also signal upcoming increases in volatility.
- The corresponding chart showcases minimal price movement during low standard deviation periods, followed by a significant price move.
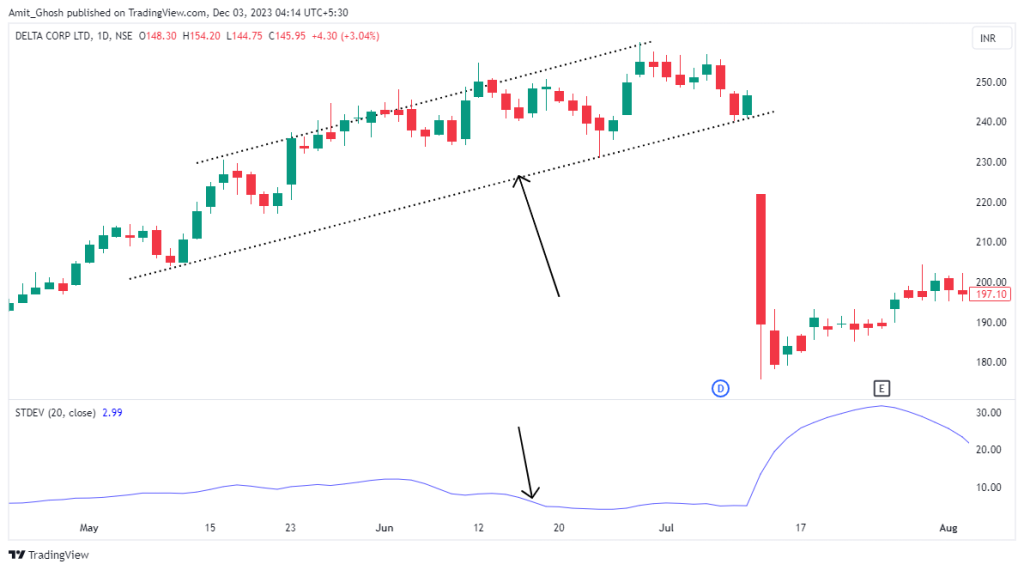
The above image shows an example of Low standard deviation. Notice that in the chart, the price does not move very far until the end of the green shaded area. In this time, the blue line remains low.
But, it also acted as a warning that a “Big Move is going to come”.
Changing Standard Deviation Period Settings
The default setting for this indicator is 20, representing the number of periods (e.g., days) over which the deviation is calculated.
- Altering the setting above 20 reduces sensitivity, while below 20 increases it.
- Changes in settings should be tested for their impact on trading effectiveness.
Effects of Increasing the Setting:
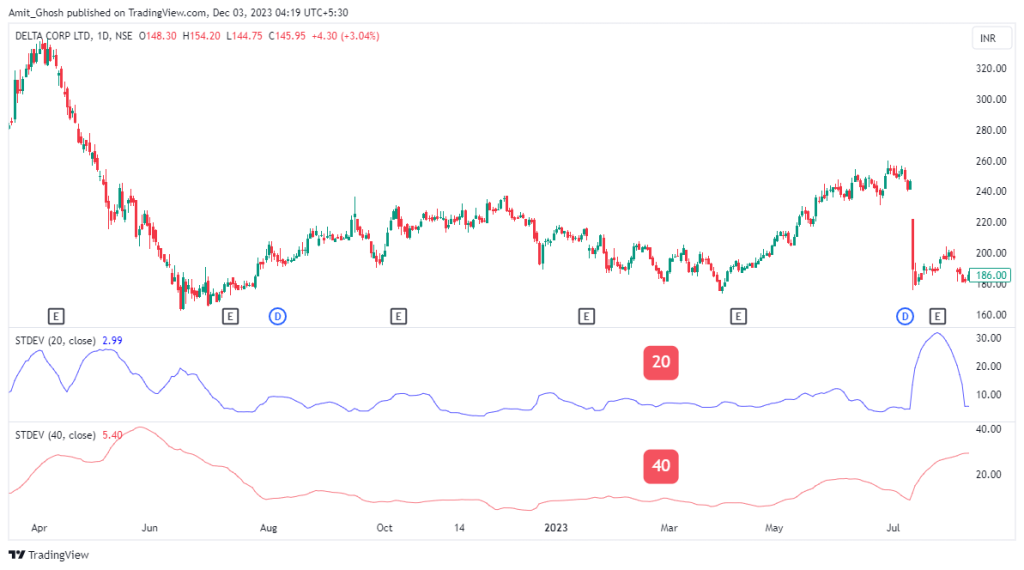
Increasing the setting to 40, for example, results in a smoother line but less frequent extreme readings. This adjustment can lead to fewer, but potentially more reliable, signals of volatility changes.
Effects of Decreasing the Setting:
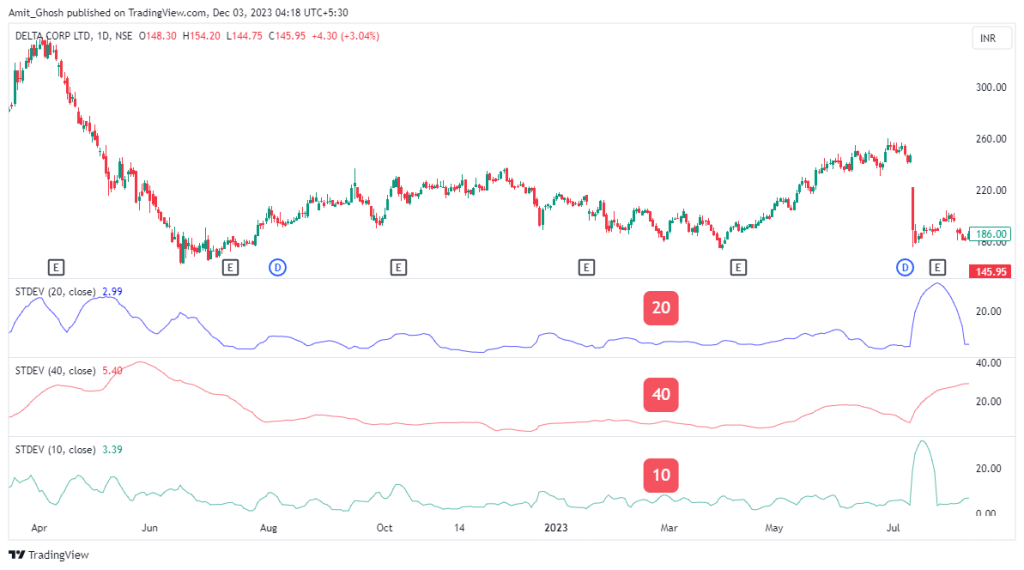
A decrease in setting, like to 10, leads to the standard deviation line reaching high or low levels more often.
- While this may increase trading opportunities, it can also result in more false signals.
- Careful consideration is needed when choosing to deviate from the standard setting of 20.
Any adjustments to the standard deviation settings should be thoroughly tested. It’s crucial to ensure that changes to the indicator’s settings positively impact your trading strategy and results.
Conclusion
So far you have learned that –
- The standard deviation indicator is a tool used to measure the volatility of an asset’s price, aiding in forecasting the magnitude of future price movements.
- On charts, this indicator is typically represented as a blue line.
- A high standard deviation reading often follows a substantial price change, indicating that a decrease in volatility might be imminent.
- Conversely, a low standard deviation suggests that recent price volatility has been minimal, hinting that a significant price movement may be on the horizon.
- While the standard deviation indicator is effective in predicting the size of price movements, it does not provide any indication of the direction of these movements.
- The default or standard setting for this indicator is 20, which calculates the deviation over the 20 most recent periods.
- Adjusting the setting above 20 decreases the indicator’s sensitivity, leading to a smoother line but fewer extreme readings.
- Lowering the setting below 20 increases the sensitivity, resulting in a more reactive line that may reach high or low levels more frequently.
- The standard 20-period setting is generally preferred by most traders, as it is considered to provide a more balanced and reliable assessment of market volatility.

