Types of Moving Averages

Types Of Moving Averages
A moving average (MA) is a cornerstone technical indicator that smooths out price data to create a single flowing line, making it easier to identify the underlying trend direction. By calculating the average price of a security over a specific number of periods, MAs help traders filter out the “noise” of random short-term price fluctuations. They are lagging indicators because they are based on past prices, but they are invaluable for identifying trends, gauging momentum, and spotting potential support and resistance zones.
While the concept is simple, several types of moving averages exist, each with a unique calculation method and responsiveness to price changes. Understanding their differences is key to applying them effectively.
Simple Moving Average (SMA)
The Simple Moving Average (SMA) is the most basic type of moving average. It is calculated by summing the closing prices of a security over a specific number of periods and then dividing by that number of periods. The result is an unweighted average, meaning every price point in the period is given equal importance.
The SMA Formula
The formula for the Simple Moving Average is straightforward:
Where:
- is the price at period i.
- is the number of periods.
How to Calculate the SMA
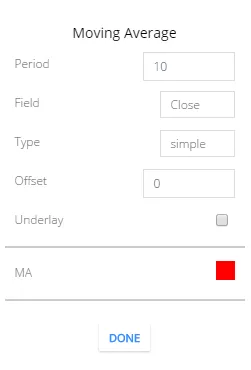
Let’s walk through a practical calculation for a 10-period SMA (SMA(10)) for Bank of India, ending on 24th April 2017. The calculation uses the daily closing prices of the last 10 trading sessions. By default, moving averages are calculated on the closing price.
First, we gather the closing prices for the 10 days leading up to and including our target date:
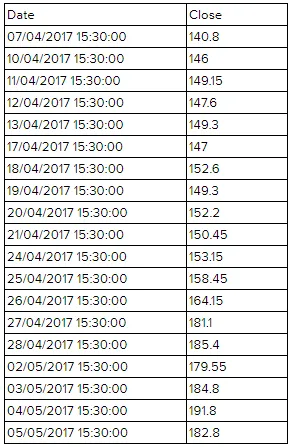
The closing prices for the last 10 periods are:
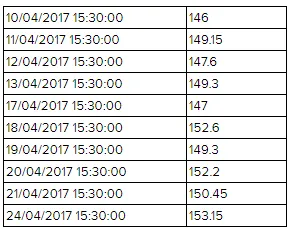
The dataset is: 146.00, 149.15, 147.60, 149.30, 147.00, 152.60, 149.30, 152.20, 150.45, 153.15.
Now, we sum these values and divide by 10:
Thus, the 10-day Simple Moving Average for Bank of India on 24th April 2017 was Rs. 149.68.
Exponential Moving Average (EMA)
The Exponential Moving Average (EMA) gives more weight to the most recent prices in the data set. This makes the EMA more responsive to new information and recent price changes compared to the SMA. While it still considers all past data points, their influence decreases exponentially over time.
For traders who want to react more quickly to trend changes, the EMA is often the preferred tool. It strikes a balance between the smoothness of the SMA and the need for a faster signal.
The EMA Formula
The calculation for the EMA is slightly more complex. It involves a smoothing factor, often called alpha (), which determines how much weight is applied to the most recent price.
First, calculate the smoothing multiplier:
Then, the EMA is calculated with the following formula:
Where:
- is the current price.
- is the EMA of the previous period.
- is the number of periods.
Double Exponential Moving Average (DEMA)
Developed by Patrick Mulloy, the Double Exponential Moving Average (DEMA) is an even faster-reacting indicator designed to reduce the lag associated with traditional moving averages. It is not simply an EMA of an EMA; instead, it uses both a single EMA and a double-smoothed EMA in its formula.
The result is a moving average that sticks closer to the price action. This heightened sensitivity makes it useful for traders working with low-beta, slower-moving stocks, such as Coal India, where capturing subtle momentum shifts is crucial.
The DEMA Formula
The DEMA calculation involves taking two times the standard EMA and subtracting an EMA that has been applied to the first EMA.
Where is the n-period Exponential Moving Average of the price.
Trading Uses of Moving Averages
Moving averages are versatile and can be used in several ways to enhance trading decisions:
- Trend Identification: The primary use is to determine the trend direction. When the price is consistently trading above a moving average, it suggests an uptrend. Conversely, when the price is below the MA, it suggests a downtrend. The slope of the MA also indicates the trend’s strength.
- Support and Resistance: In a trending market, moving averages often act as dynamic support (in an uptrend) or resistance (in a downtrend). Traders watch for price to pull back to the MA as a potential entry point.
- Crossovers: A popular trading signal is the crossover of two moving averages of different lengths. A “Golden Cross” occurs when a short-term MA (e.g., 50-day) crosses above a long-term MA (e.g., 200-day), signaling a potential bullish trend. A “Death Cross” is the opposite and signals a bearish trend.
Moving Averages as a Base for Other Indicators
The utility of MAs extends beyond their direct application. They form the foundational building block for many other essential technical indicators:
- Moving Average Convergence Divergence (MACD): This popular momentum indicator is built by subtracting a long-term EMA (typically 26 periods) from a short-term EMA (typically 12 periods).
- Bollinger Bands: This volatility indicator consists of a central SMA (typically 20 periods) with upper and lower bands that are plotted at two standard deviations away from the central average.
Best Timeframes for Indian Markets
The choice of moving average period depends heavily on your trading style and objective.
- Long-Term Investing (Daily/Weekly Charts): For analyzing long-term trends in NIFTY 50 or other large-cap stocks, the 50-day, 100-day, and 200-day SMAs are industry standards.
- Swing Trading (Daily/Hourly Charts): Swing traders often use EMAs for their faster response. Common periods include the 10, 21, and 50-period EMAs to capture medium-term momentum.
- Intraday Trading (1-min to 15-min Charts): For intraday setups on BANKNIFTY or volatile stocks, very short-term EMAs like the 9-period and 21-period are popular for identifying immediate trend shifts and entry points.
Ultimately, the “best” period is the one that has historically provided the clearest signals for the specific security and timeframe you are trading. Backtesting different MA lengths is a crucial step in developing a robust strategy.