Market Volatility
- What volatility is
- Why volatility is important in trading
- How volatility is measured
- And how you use volatility to trade
Volatility
- If the price of an asset has a high volatility, there is more risk associated with trading it, but greater potential for profits.
- If an asset has a low volatility, there is a lower risk trading it, but less profit potential.
- Moving averages,
- Bollinger Bands, and
- Average true range
Moving Average and Volatility
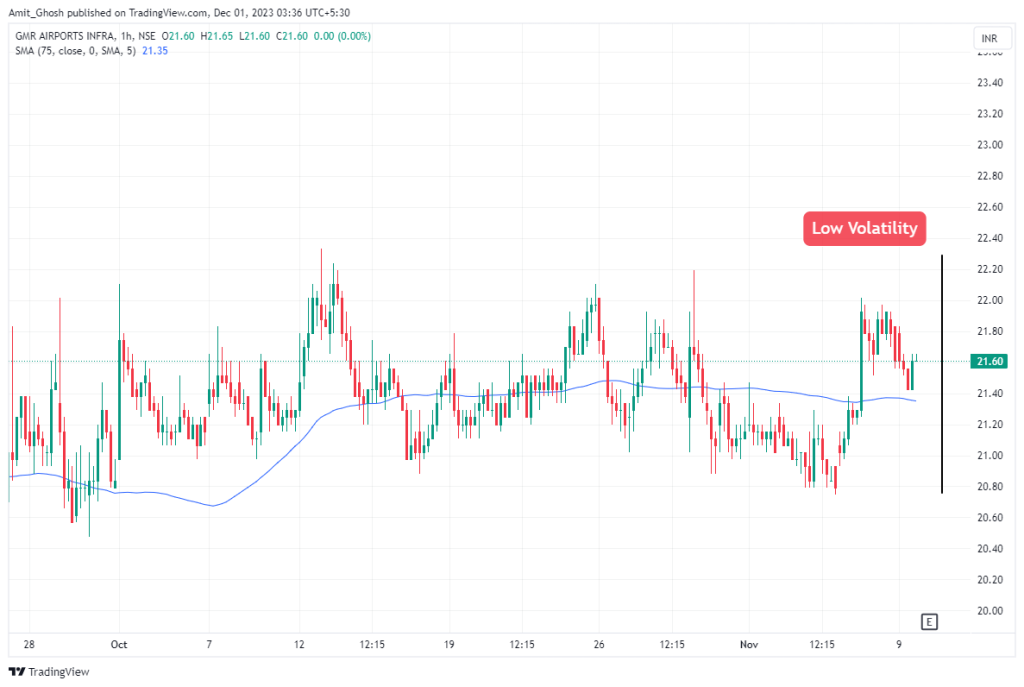
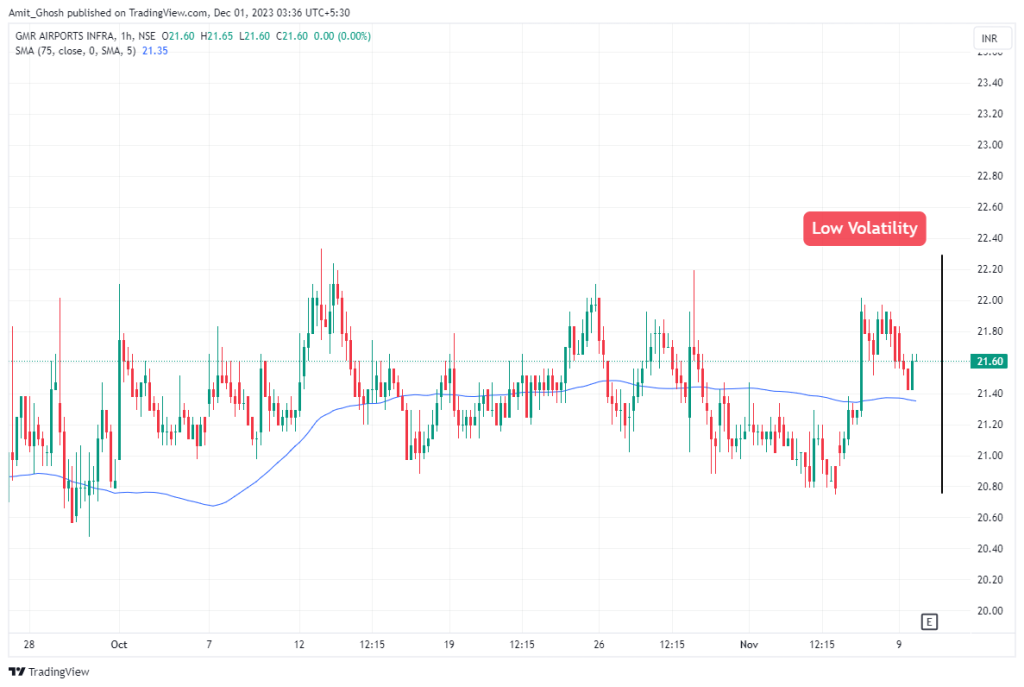
Let’s first take a look at moving averages.
Moving averages are displayed on the actual price chart, and the relation of the moving average to the current price gives an indication of the volatility of the asset. The further the price is from the moving average, the higher the volatility of the asset.
Here you can see an example of Low Volatility ->
Moving Average and Bollinger Bands
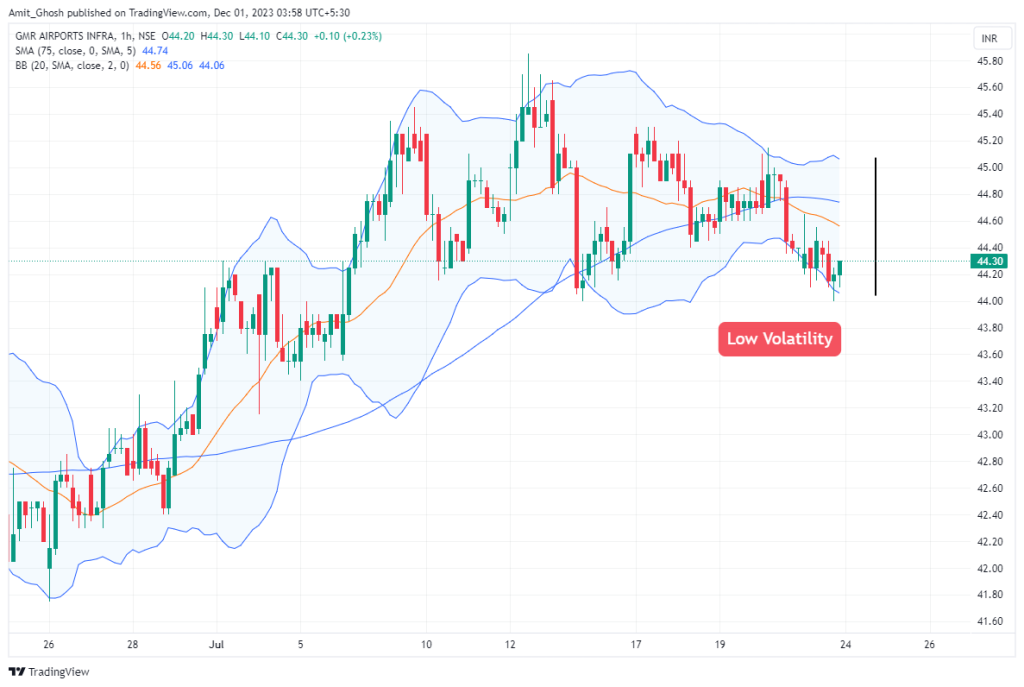
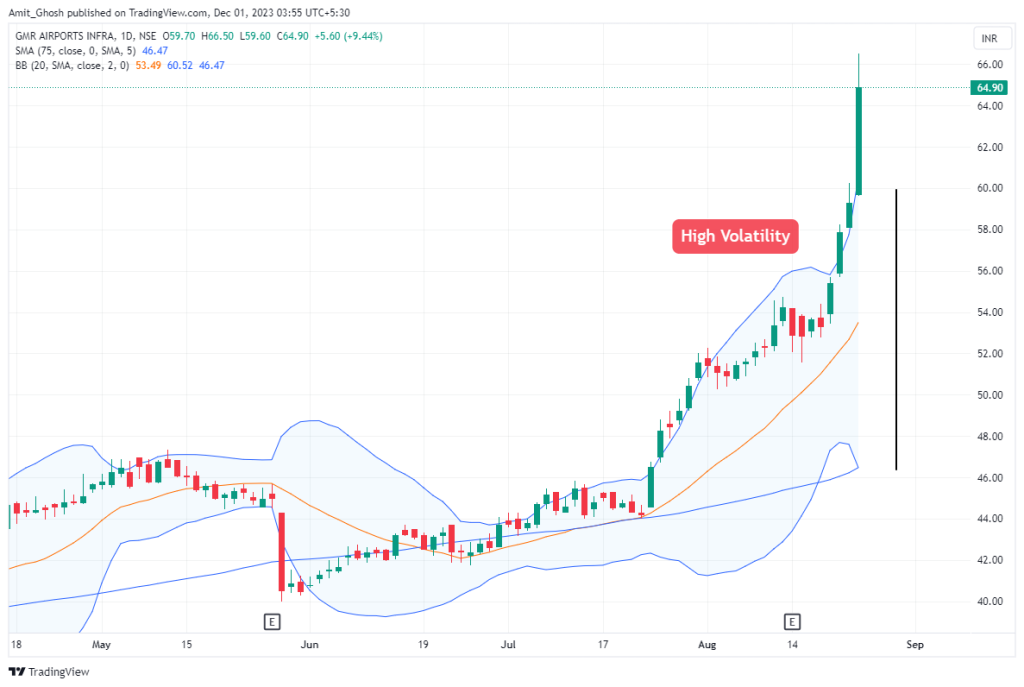
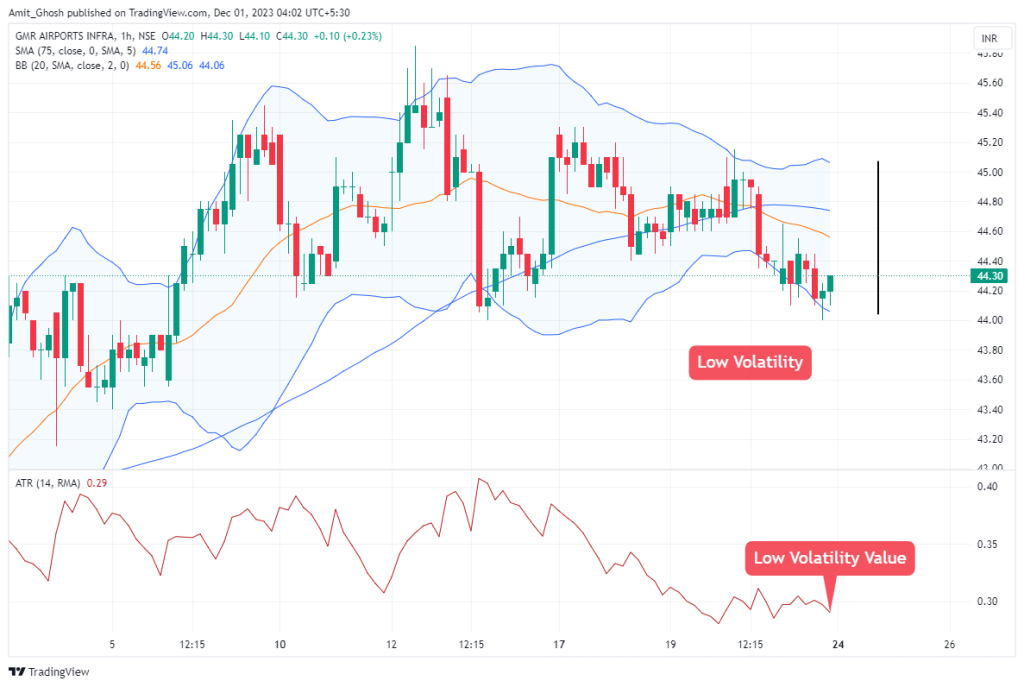
Bollinger Bands display the volatility slightly differently. Several lines are applied to the price action, which squeeze together when volatility is low and expand when it increases.
Here you can see an example of Low Volatility ->
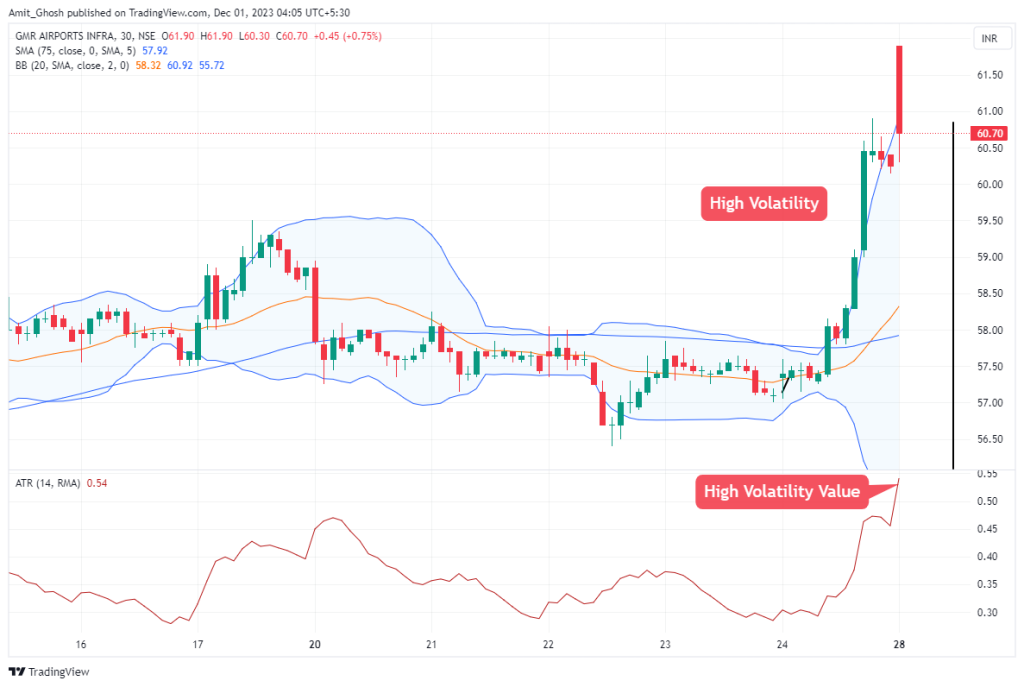
An asset with expanded bands has a high volatility.
Here you can see an example of High Volatility ->
Moving Average and ATR (Average True Range)
The average true range indicator, also known as ATR, is a tool that measures the volatility but gives an actual value. So rather than observing the price in relation to an indicator, such as a moving average or Bollinger Bands, the ATR gives a value.
The higher the value, the higher the volatility.
Here you can see an example of High Volatility ->
The ATR also shows whether the volatility is increasing or decreasing, as well as what the volatility is at a given time.
In this image, you can see “Increasing Volatility” in ATR.
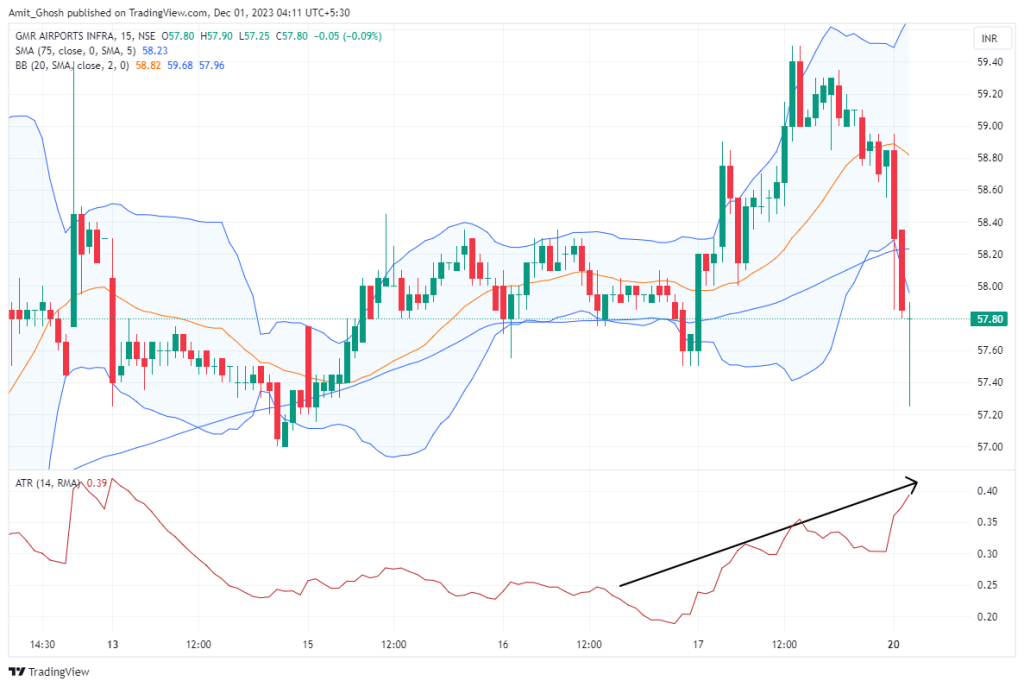
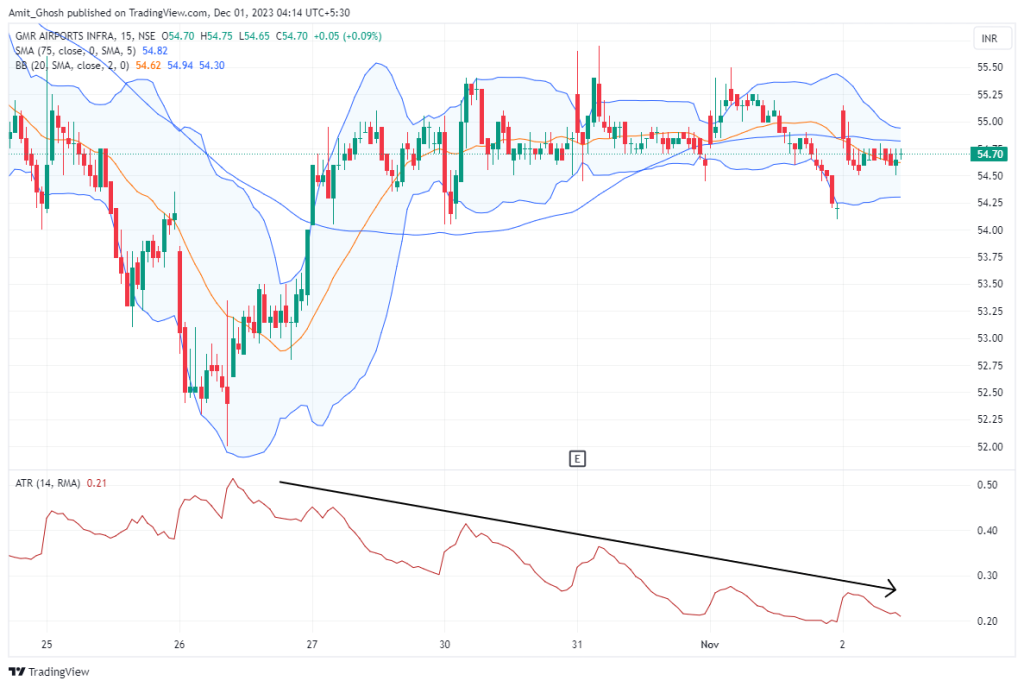
It is important to note that the ATR indicator does not give the direction of the trend, simply whether the volatility of that asset is increasing or decreasing.
When the ATR line goes up, the volatility has gone up. When volatility is low and decreasing, the probability of large profitable moves occurring is greatly reduced. The trader should avoid this type of market environment.
In contrast to this, when anticipating large moves, particularly breakouts, it is important to trade in times when volatility is high.
When volatility is high, the probability of a large profitable move occurring is higher, and traders have a greater chance of making money.
Conclusion
- Volatility is simply a measurement of how much the value of an asset changes over a period of time.
- Therefore, the higher the volatility, the greater the profit potential for that asset.
- Likewise, if the asset has a low volatility, it is best to avoid trading it.
- We can use various indicators to tell us the volatility of an asset at any given time.

