Average Directional Index (ADX) Indicator
- What the ADX is
- How to use the ADX to gauge trend strength
- How to read the ADX indicator
- How to assess the trend direction when using the ADX indicator
- What the pros and cons are of adjusting the ADX settings
Average Directional Index (ADX) Indicator
The average directional index or ADX is used to determine how strong a trend is. It provides the trader with a reading ranging from 0 to 50.
- The higher the reading, the stronger the trend.
- Conversely, the lower the reading, the weaker the trend.
The ADX is very useful in helping you gauge the strength of the trend. This is beneficial if you are a trend trader and are looking for strong trends which can offer high probability trades. It is important to note that the ADX does not provide buy or sell signals.
How to use the ADX to gauge trend strength
Let’s now look at the ADX readings and what they can tell us.
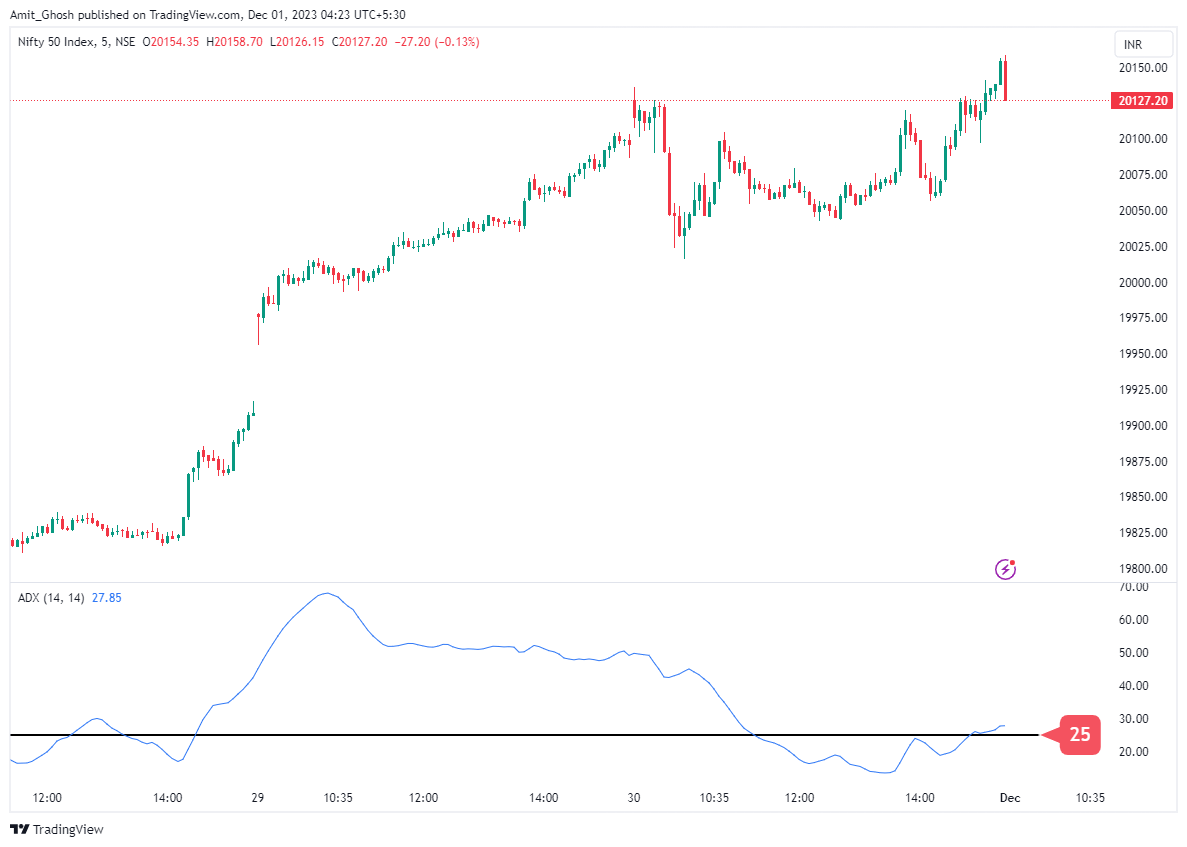
- When the blue ADX line goes below 25, it means the market is just moving back and forth or the trend is too weak to trade.
- If the blue ADX line goes above 25, it shows that a strong trend has started.
- A reading of between 30 and 50 signals a strong trend.
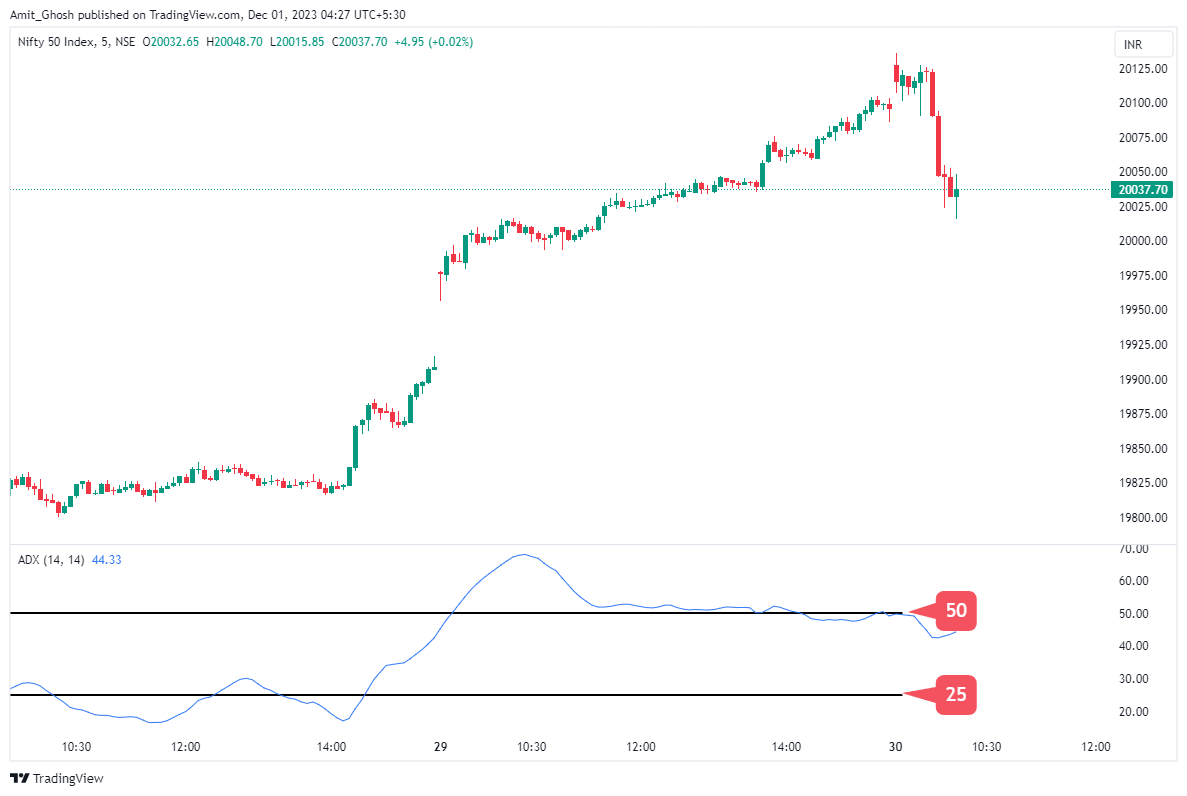
As a trend follower, you would want to see a reading of above 25 as this signals a strong trend. However, once the indicator reading is over 50, caution should be taken as the trend is considered extended and the market can very often pull back from extremes.

Here is the aftermath ->
How to read the ADX indicator
The ADX consists of three lines, which all measure price action in slightly different ways:
- The ADX line
- The DI+ line
- The DI- line
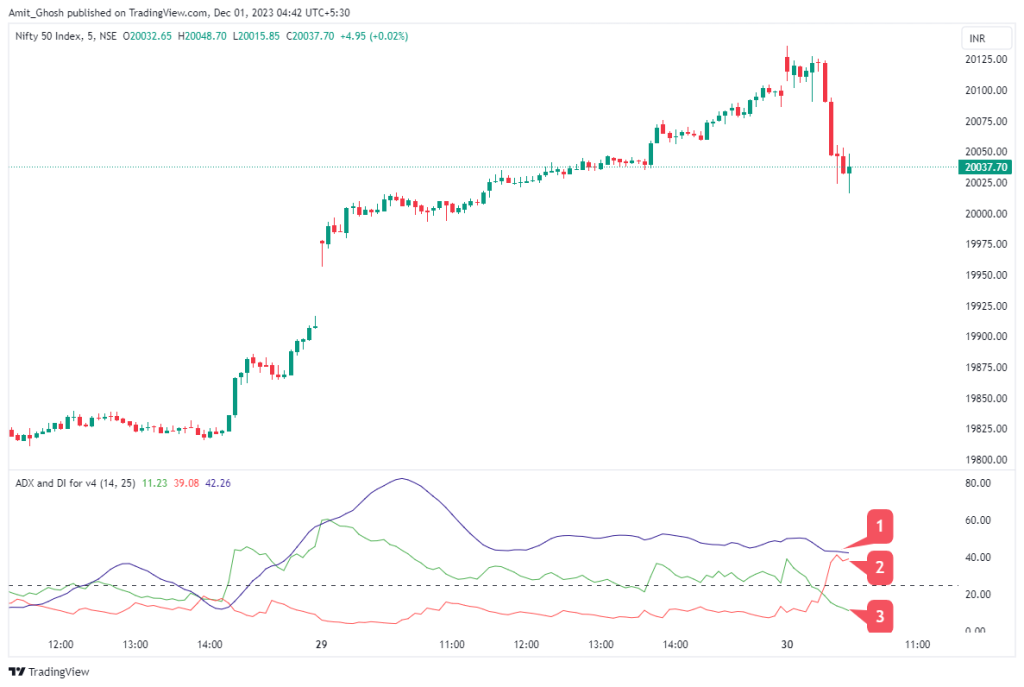
- Main ADX line
- DI- line
- DI+ line
- When the DI+ line rises above the DI- line, you can consider the trend to be up.
- When the DI+ line is below the DI- line, you can consider the trend direction to be down.
- When the DI+ line crosses above the DI- line, it signals that the trend is going upwards.
- If the ADX is above 25, it confirms that this is a strong trend.
Changing the ADX Period Settings
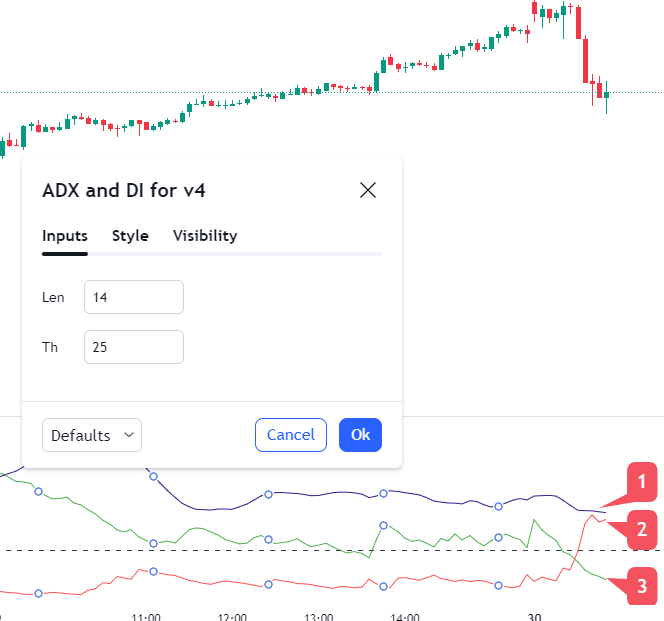
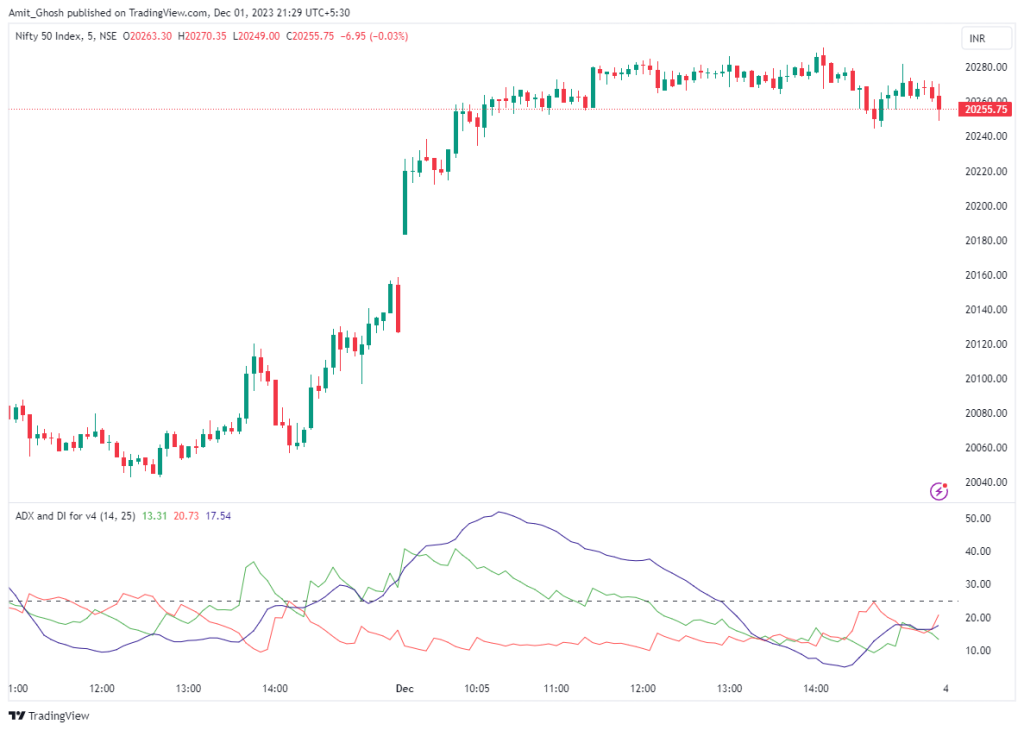
- The ADX gets its information by looking at a certain number of trading periods (or candles) on the chart. Usually, it looks at 14 periods, but you can change this to match how you like to trade.
- Most traders change the settings to somewhere between 7 and 30 periods to find what works best for them.
Normal Period Settings -
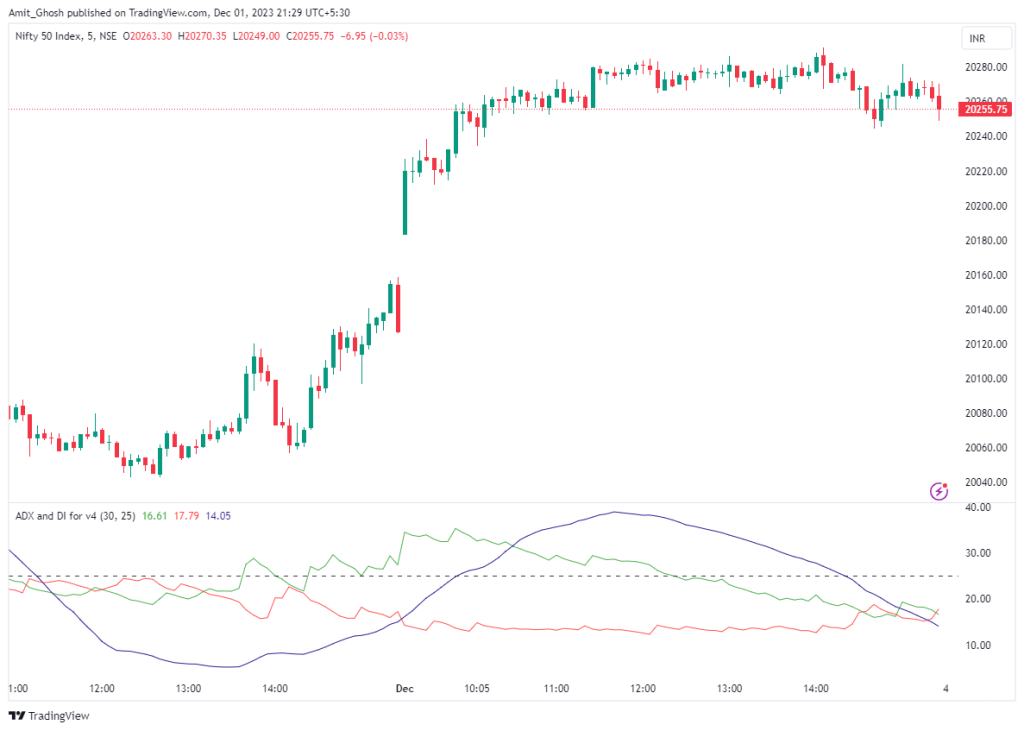
Higher Period Settings -
- A trader can find an advantage to using a higher setting as it will result in more reliable trend readings.
- However, it will take longer for the indicator to confirm a trend is underway, increasing the chance of missing a substantial move.
Smaller Period Settings -
- On the other hand, using a lower period setting will result in trends being detected earlier on.
- However, there is a chance of the indicator giving more false signals.
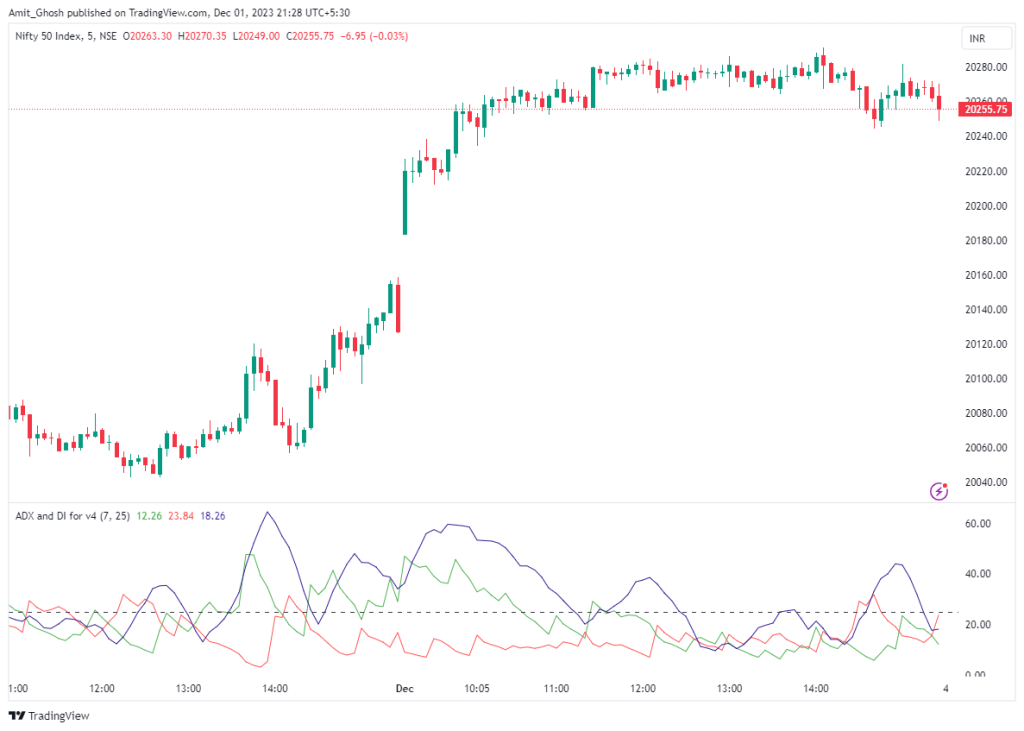
It is important to note that the effect of the D+ and the D- lines are usually not noticeable when the period settings are adjusted as the overall reading is the same.
In this example, you can clearly see the D- line (red line) is above the D+ line (green line), which indicates a upward trend regardless of the differences in period settings made to the indicator.
When changing the parameters of the ADX, it is important to test whether your changes are actually improving or worsening the results of your strategy.
Conclusion
- The ADX is primarily a trend strength indicator.
- It is a useful confirmation tool, but it does not provide buy or sell signals.
- It consists of three lines, the D plus, D minus and ADX lines, which show the strength of a trend and also indicate which direction to trade in.
- It provides a reading which generally ranges between zero and 50.
- A reading below 25 indicates a weak trend.
- A reading of above 25 signals a strong trend.
- A reading between 30 and 50 signals an extremely strong trend.
- A reading of over 50 signals that a trend is at its peak and could soon reverse.
- The standard setting for the ADX is 14 periods, and traders usually opt for a setting of between 7 and 30 periods.
- A higher setting will smooth price action and provide more reliable signals.
- A lower setting will result in more trends being detected earlier, but can also provide false signals.

