Accumulation Distribution Indicator (ADI)
In this chapter, you will learn:
- What the Accumulation Distribution Indicator (ADI) is and its purpose in market analysis,
- How to identify market tops and bottoms using the ADI,
- The significance of divergence between the ADI and price movements,
- Techniques for confirming potential trend reversals and entry points using the ADI,
- Strategies for adjusting the ADI settings and the implications of these adjustments on market interpretation.
The ADI Indicator
The Accumulation Distribution Indicator (ADI) is a key momentum indicator in trading, used by traders to anticipate trend reversals by pinpointing market tops and bottoms. The ADI accomplishes this by illustrating the correlation between an asset’s price and the volume of buyers and sellers in the market.
It helps traders discern whether the market is dominated by bulls (accumulating) or bears (distributing) through observing divergences between the asset’s price and the indicator.
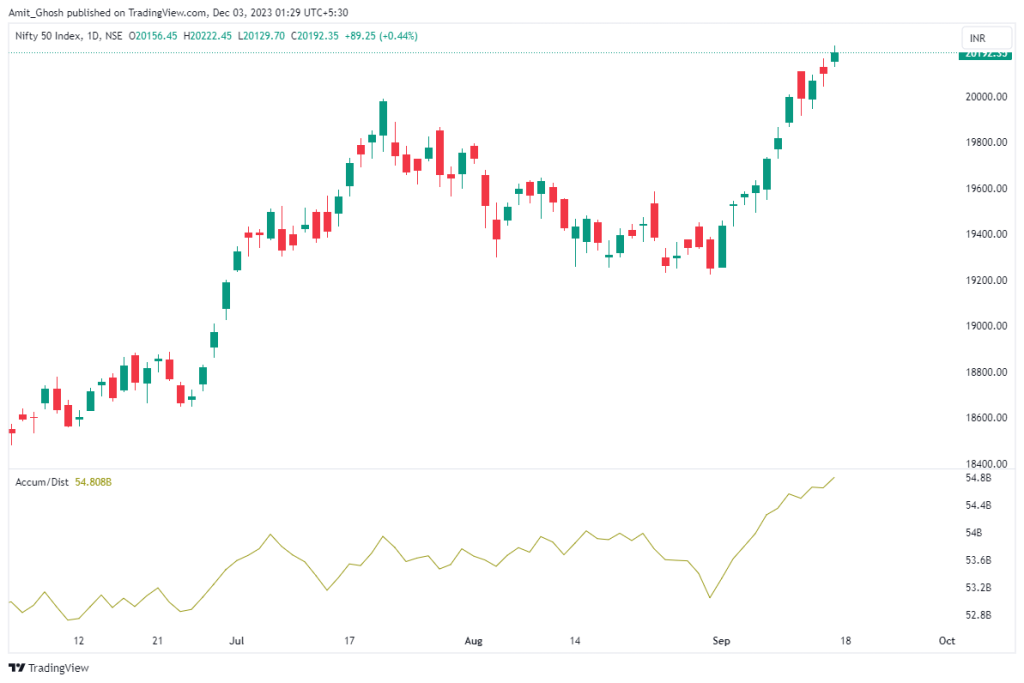
The indicator moves up when the closing price is closer to the day’s high, suggesting buying pressure, and moves down when the closing price is closer to the low, indicating selling pressure.
How to trade using ADI Indicator
For Bullish Signals
For instance, if there’s a general downtrend in an asset’s price but a recent uptick is noticed, it might indicate increasing demand – suggesting that sellers are weakening and buyers are gaining strength.
In such cases, the ADI will typically begin moving in the opposite direction of the price, hinting at a possible trend reversal.
Look for Diverenge from the Price:
The effectiveness of the ADI is best utilized by searching for divergences between the indicator and price movements. For instance, in a bullish scenario, you would look for the price to record lower lows while the ADI marks higher lows, indicating the market might be shifting from a downward to an upward trend.
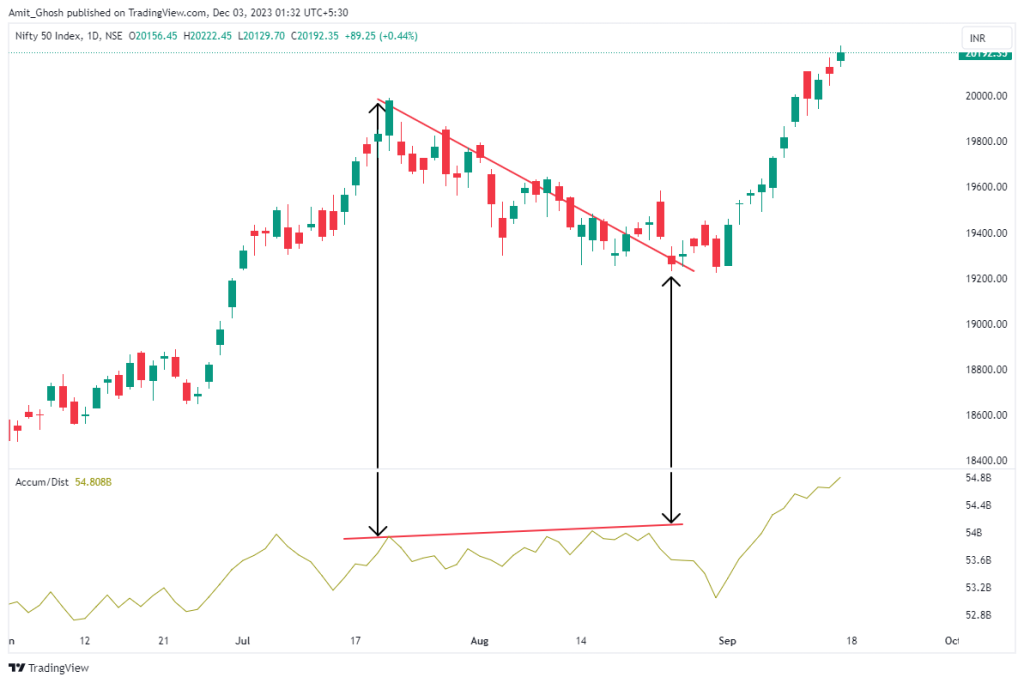
The real-life application of this concept is evident in the above chart, where the price is making lower lows, but the ADI is making higher lows.
This divergence suggests a bullish signal, pointing towards a potential upward trend in the market.
For Bearish Signals
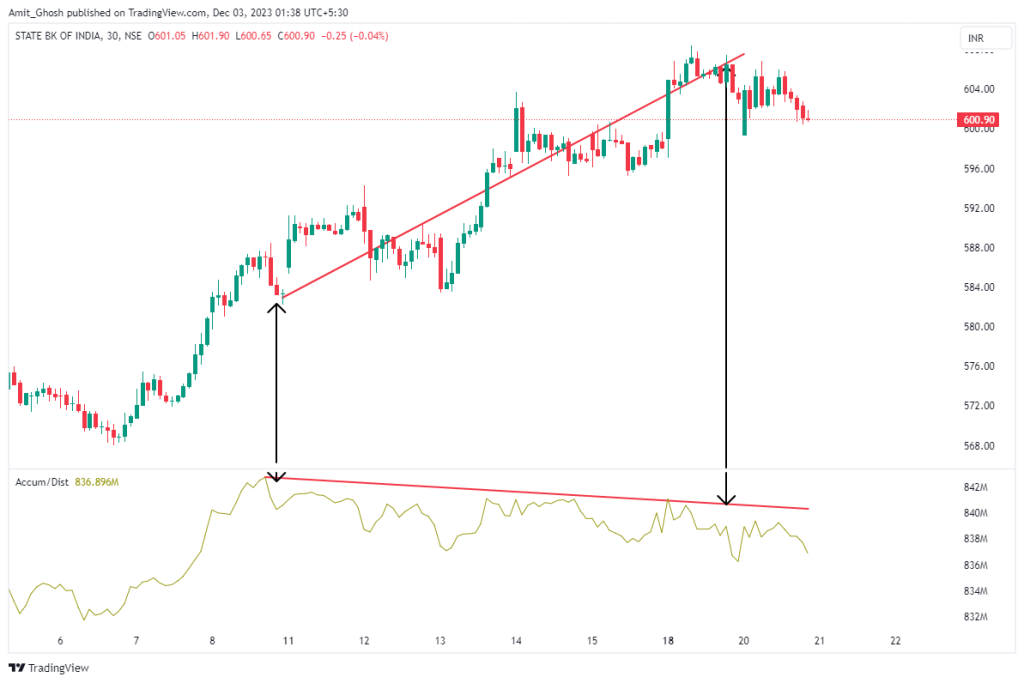
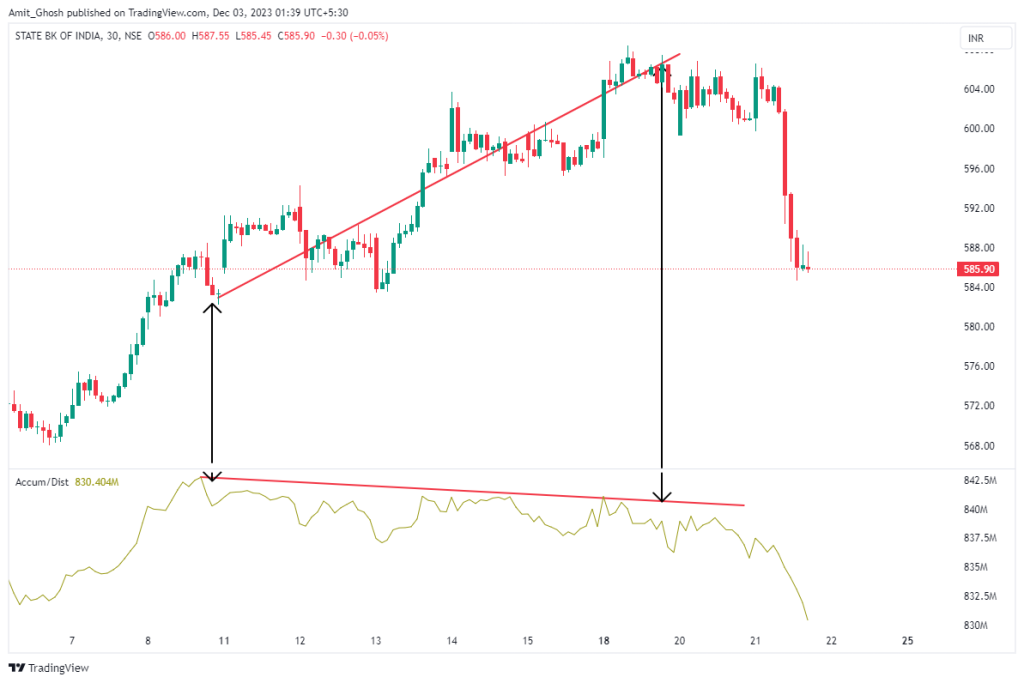
Conversely, if the price is making higher highs while the ADI is making lower highs, as shown in the above chart, it signals that the current uptrend might be losing momentum and a downward move could be imminent.
In the following image, you can see the aftermath –
The ADI works best in sideways trend
The ADI shows its greatest potential in markets that are ranging or moving sideways without strong directional movements. This environment allows for more accurate interpretations of the indicator’s signals.
In the following chart of Vedanta in sideways trend market, You can see all the signal generated yielded a good return.
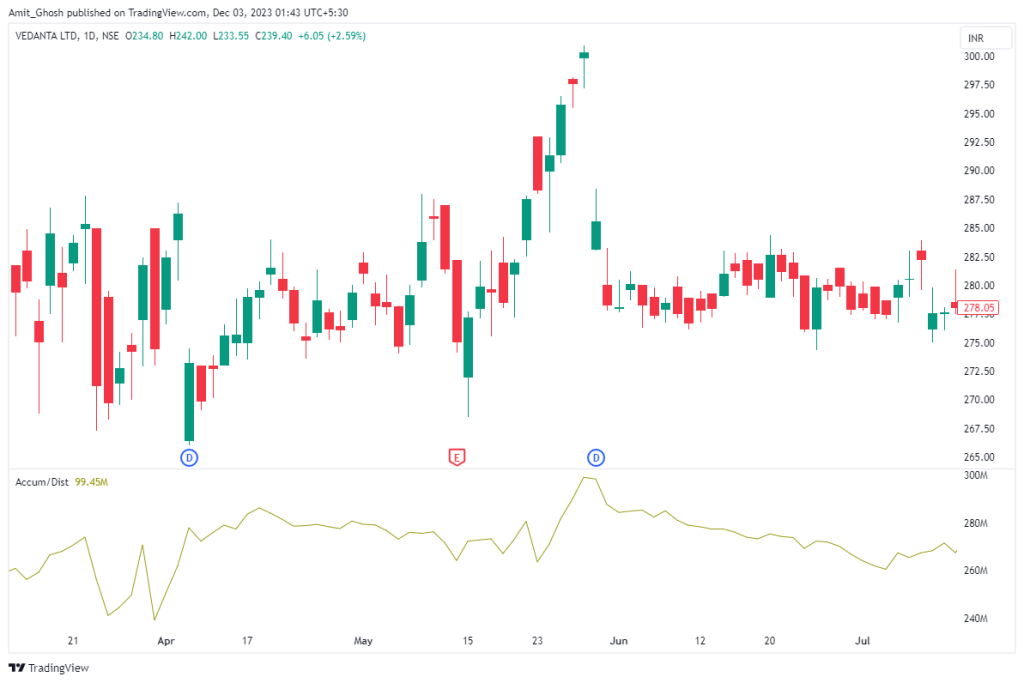
However, in trending markets, the ADI might generate false entry signals leading to potential losses. This is because, in strong trends, the market often pauses before continuing its direction, which can mislead the indicator as well as all divergent based strategies.
To mitigate these risks in trending markets, it’s advisable to use the ADI in harmony with the prevailing trend.
- This means looking for buying opportunities during pullbacks in a strong uptrend and selling signals during retracements in a strong downtrend, as demonstrated in the final chart.
- Employing this strategy with the ADI in trending markets can significantly reduce the likelihood of incurring heavy losses and consecutive losing trades, especially in scenarios of strong and persistent market trends.
Conclusion
So far, you have learned that:
- The Accumulation Distribution Indicator (ADI) is a critical tool used by traders to predict trend reversals.
- It is effective in identifying potential bottoms where a declining price may start to rise, and tops where an increasing price might begin to fall.
- The ADI operates by examining the relationship between an asset’s price and the volume of buyers and sellers in the market.
- It assesses whether the market participants are predominantly bulls (accumulating) or bears (distributing), and identifies divergences between the recent and current price movements.
- For long trades, the strategy involves looking for instances where the price is making lower lows while the ADI is making higher lows.
- Conversely, for short trades, the focus is on situations where the price makes higher highs while the ADI makes lower highs.
- The ADI shows its greatest effectiveness in markets that are ranging or moving sideways.
- However, in trending markets, the ADI may produce false entry signals.
- To mitigate this, it’s recommended to align the use of ADI with the overall market trend – seeking buying opportunities in a rising market during retracements, and selling opportunities in a falling market during upward retracements.

