Modifying Entropy Trade Setup with Bollinger Bands %

The original Entropy Trade Setup combined four distinct indicators: Bollinger Bands for volatility, a Volume Histogram for activity, and both the Stochastic and Money Flow Index (MFI) oscillators for momentum. While effective, this setup involved monitoring multiple, sometimes conflicting, signals. Amit Ghosh later refined this by replacing the two oscillators with a single, derived indicator: Bollinger Band %B.
The original four-indicator setup — recap
The classic setup used the following indicators and settings on a standard price chart.
| Indicator | Setting |
|---|---|
| Bollinger Bands | Source: Close, Length: 20, StdDev: 2, MA Type: EMA, Channel Fill: Yes |
| Volume Histogram | Default settings, often with a moving average overlay |
| Stochastic (Smooth) | %K Length: 14, %K Smoothing: 3, %D Smoothing: 3 |
| Money Flow Index (MFI) | Length: 14 |
Why replace Stochastic and MFI with BB%B
The move from two separate oscillators to a single integrated indicator was driven by three main factors:
- Simplicity: It consolidates two semi-redundant momentum signals into one. This reduces the cognitive load and potential for conflicting information during trade analysis.
- Alignment: The %B indicator is intrinsically tied to the Bollinger Band framework, which is the core of the Entropy system. It measures price position relative to the bands, making it a more coherent signal than external oscillators.
- Consistency: Using %B establishes uniform thresholds (e.g., 0.8 for overbought, 0.2 for oversold) that are directly derived from the volatility envelope, leading to more consistent behaviour across different assets and timeframes compared to the more arbitrary levels of Stochastic or MFI.
The BB%B refinement
Bollinger Band Percentage B (%B) quantifies where the last closing price is in relation to the upper and lower bands. It is calculated as:
The resulting value oscillates between 0 and 1, providing clear zones for market state analysis.
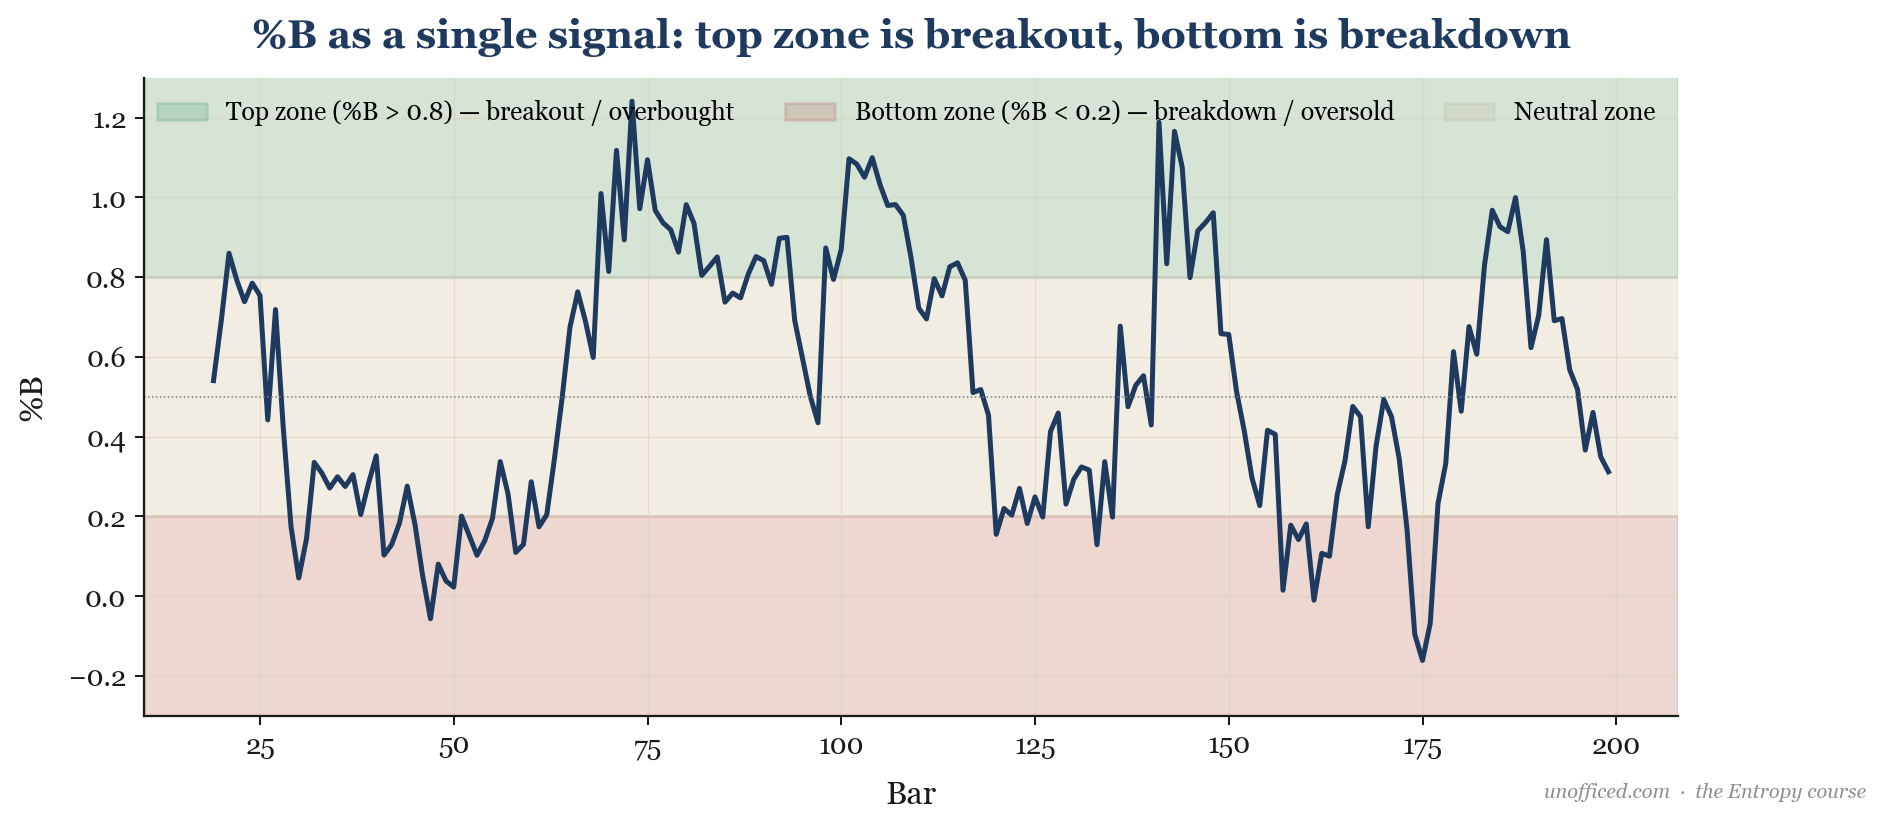
The key thresholds are:
- > 0.8: Price is in the upper zone, indicating breakout strength or overbought conditions.
- < 0.2: Price is in the lower zone, indicating breakdown strength or oversold conditions.
- 0.4 to 0.6: Price is in the neutral middle zone, close to the moving average basis line.
The refined entry rule
The entry rule becomes more direct with %B as the primary trigger, supported by volume. For a long entry:
- The %B indicator crosses above a top threshold, typically 0.8. This signals that price is pushing against the upper volatility boundary.
- The volume on the trigger candle is significantly higher than recent average volume (e.g., current volume > 1.2 × 14-period average volume). This confirms conviction behind the move.
- There are no major fundamental events scheduled for the stock, such as earnings announcements or regulatory hearings, which could override the technical setup.
The rule for a short entry is the mirror image: %B crosses below a bottom threshold (e.g., 0.2) on high volume.
Stack comparison
The visual difference between the two setups is stark. The original four-panel layout is replaced by a cleaner two-panel chart, reducing the analytical burden on the trader.
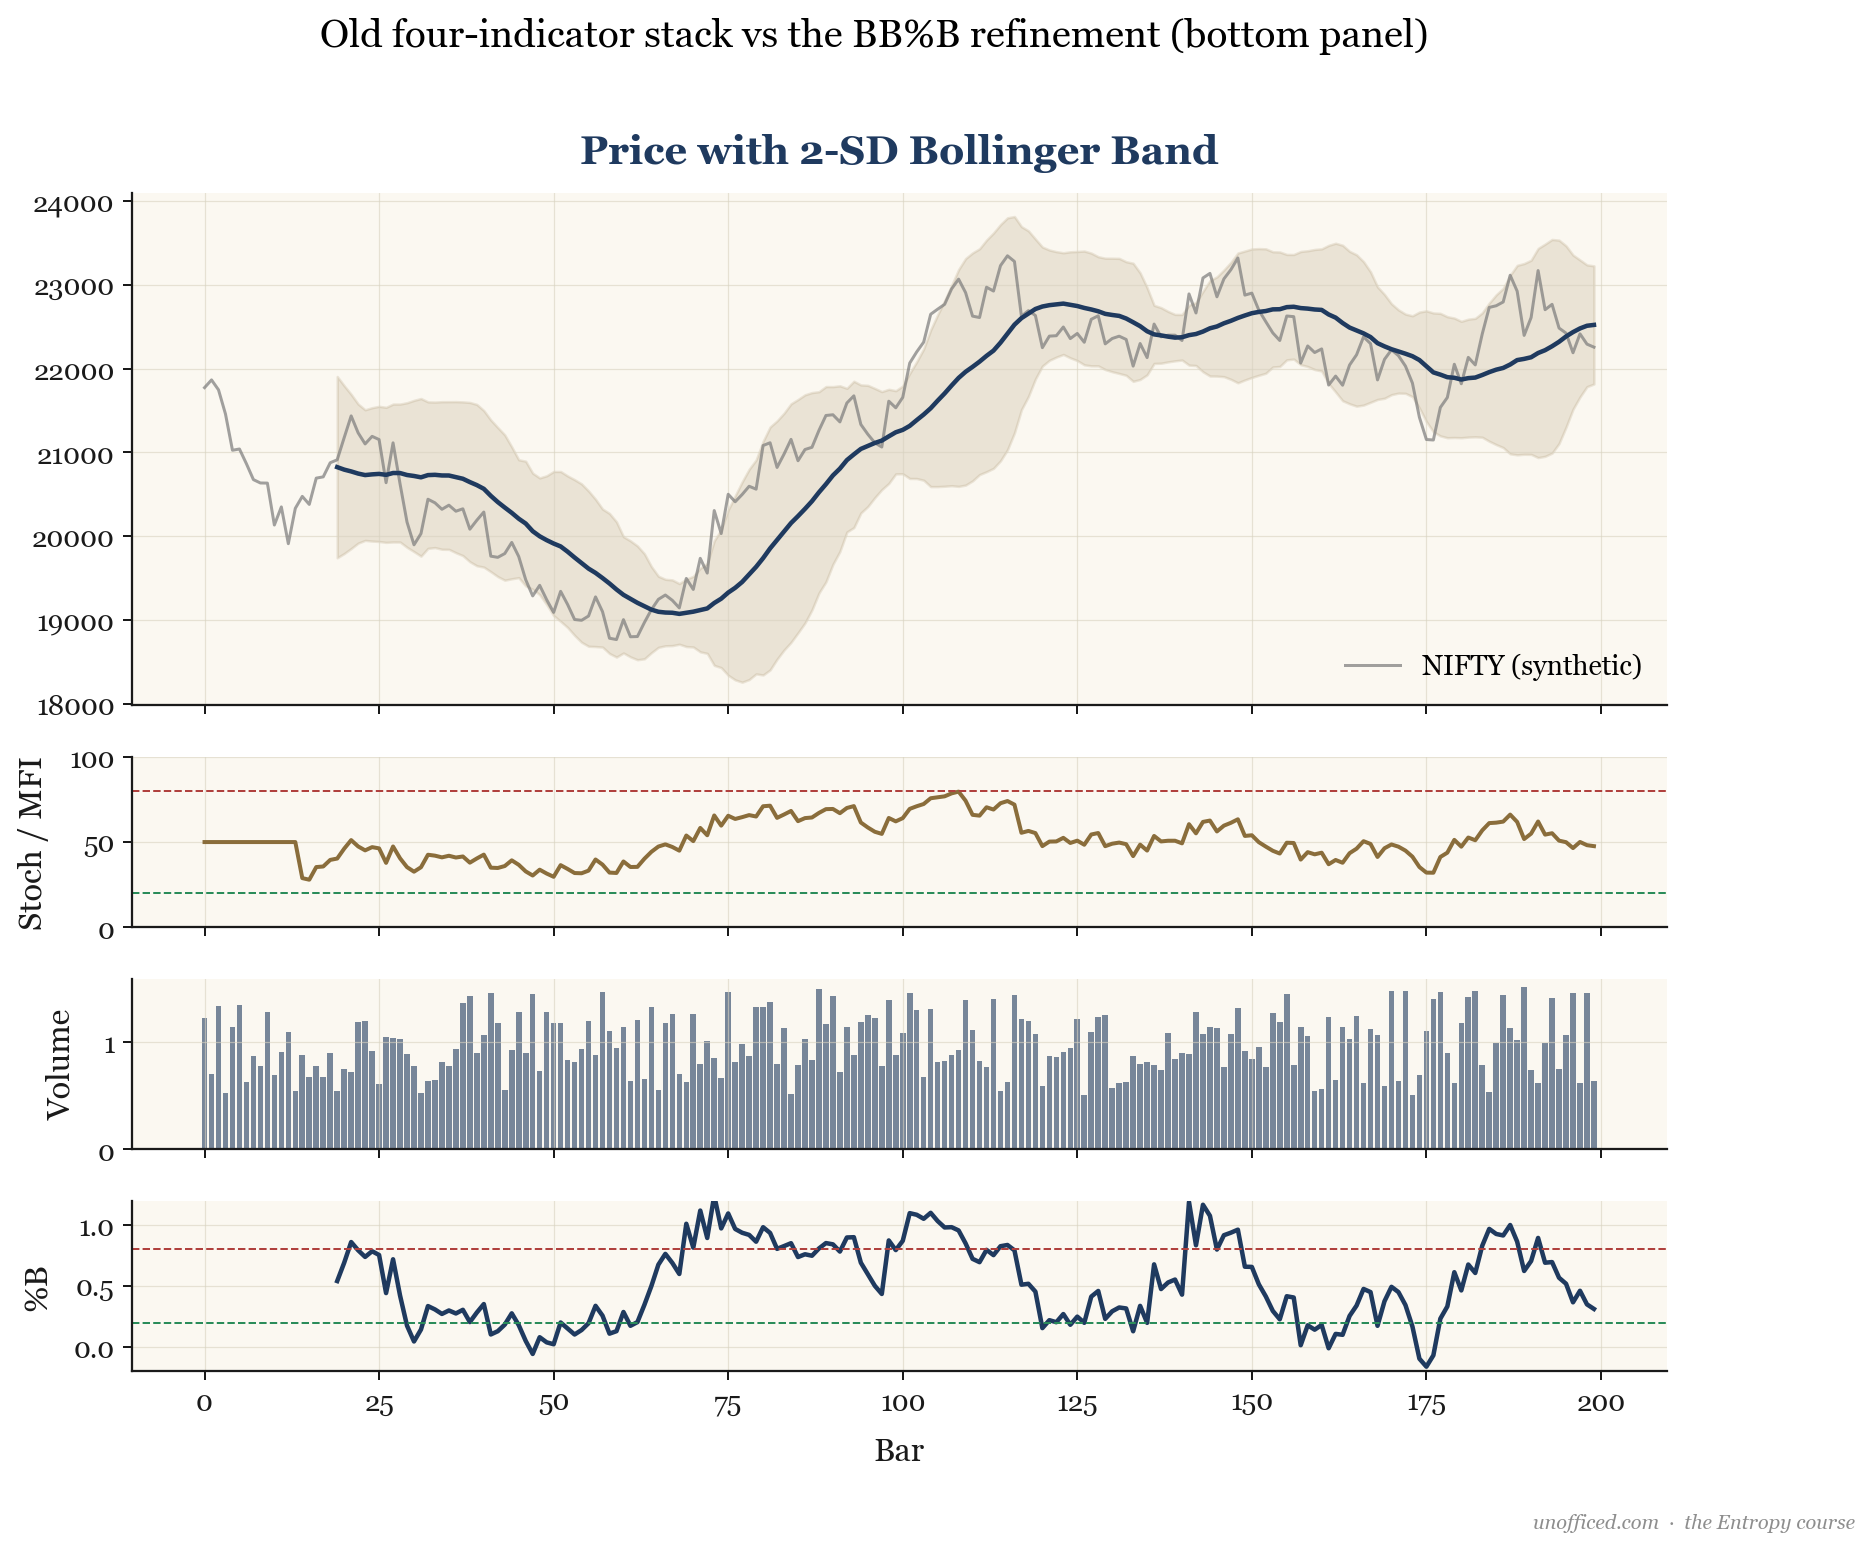
As the comparison on the NIFTY chart shows, the core Bollinger Band price chart remains the same. The refinement simply replaces the lower two panels (Stochastic and MFI) with the single, more integrated %B indicator, making the entire analysis native to the Bollinger framework.
Summary
The modification to the Entropy setup represents a move towards minimalism and system coherence.
- The four-indicator setup was simplified to a two-indicator one.
- Stochastic and MFI were replaced by Bollinger Band %B.
- %B measures price position relative to the bands, ranging from 0 to 1.
- Entry triggers are now based on %B crossing thresholds (>0.8 for long, <0.2 for short).
- This change reduces cognitive load and keeps the signals within a single theoretical framework.
This refined entry trigger, based on %B and volume, forms the foundation of the Bollinger Reversal Strategy (BRS), which adds specific candlestick patterns to further qualify trade entries.