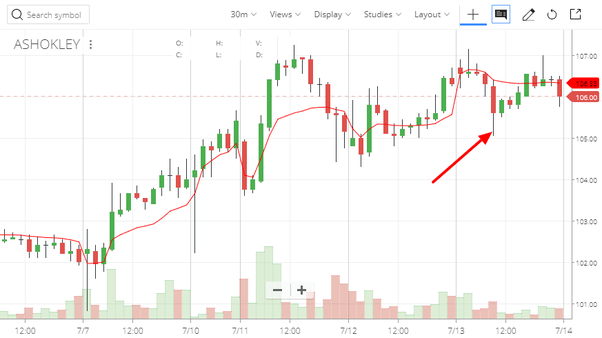
What is Price Action
In the complex world of financial markets, one concept stands out as a cornerstone of analysis and strategy: Price Action. It’s a term you’ll often hear in trading circles, and it’s vital for understanding how asset prices move. In this article, we’ll delve into the fascinating realm of Price Action, exploring what it is, how it’s analyzed, and why it matters to traders.
The Essence of Price Action
At its core, Price Action is the study of a security’s price movements over time. It encapsulates the raw, unadulterated data of an asset’s value as it ebbs and flows in the market. What makes Price Action distinct is that it doesn’t concern itself with the underlying fundamentals of the security, such as earnings reports, economic indicators, or company news. Instead, it focuses solely on the historical data of price changes and market behavior.
This simplicity is what gives Price Action its unique character. It is often described as a “chartless” method because it doesn’t rely on intricate charts cluttered with indicators and overlays. All one needs to engage in Price Action analysis is access to recent historical price data and an understanding of past price movements.
Price Action Strategies
Within the realm of Price Action, a subset of strategies emerges, aptly named Price Action Strategies. These strategies revolve around the analysis of historical prices, primarily using candlestick charts. Candlestick charts provide a graphical representation of price movements over time, making it easier for traders to identify critical patterns and trends.
One of the fundamental concepts in Price Action Strategies is the identification of swing lows and swing highs. These are pivotal points in price movement that signal potential trend reversals. While it’s possible to recognize these points without charts, the visual representation of candlestick patterns simplifies the process and reduces the risk of misinterpretation.
Indicators and Price Action
In the world of trading, indicators are often used to supplement analysis. While some indicators, like Bollinger Bands, are considered Price Action indicators because they are constructed based on historical price data, others, such as the Volume Profile, are not.
The distinction lies in the interpretation of the data. Price Action indicators derive their signals directly from past prices, whereas indicators like the Volume Profile incorporate additional information, such as trading volume at specific price levels. This added dimension can impact trading decisions, making it important for traders to understand the differences between various indicators.
Trailing Stops and Trigger Points
In practical trading, Price Action plays a crucial role in decision-making. Traders often use Price Action to set trailing stop-loss levels. This involves adjusting the stop-loss order based on recent price movements. For example, a trader might place a trailing stop at the high of the last candle. If the price moves in their favor, the stop level adjusts accordingly, allowing for potential profit-taking while minimizing losses.
Moreover, Price Action is often employed to identify trigger points. These are specific price levels that, when breached, can initiate significant market movements.

For instance, a long wick on a candlestick chart can indicate strong buyer presence, and traders might say, “Crossing this level will trigger Price Action.” This means that if the price surpasses that level, it signals a change in market sentiment, potentially leading to a rally.
However, it’s essential to note that these trigger points can also lead to stop-loss orders being activated. If traders place stop-loss orders near these levels, a breach could trigger a cascade of orders, leading to abrupt market movements.
We want to ride that!

