Fibonacci Levels

In this chapter, you will learn:
- What Fibonacci levels are and the mathematical sequence behind them.
- How to calculate and draw Fibonacci retracement and extension levels.
- Why these levels often act as significant support and resistance.
- Practical methods for using Fibonacci levels to find entries, set targets, and place stop-losses.
- Common pitfalls to avoid when incorporating Fibonacci analysis into your trading.
What is the Fibonacci Tool?
The Fibonacci tool is a technical analysis indicator that plots horizontal support and resistance levels on a chart. These levels are based on key numbers in the Fibonacci sequence, a mathematical pattern discovered by Leonardo of Pisa in the 13th century. The core premise is that after a significant price move in one direction, the market will “retrace,” or pull back, by a predictable percentage before continuing in its original direction.
For example, in a strong uptrend, the price will move up, then pull back downwards to a certain level, before resuming its upward journey. Fibonacci analysis helps us anticipate where these turning points might occur.
The Mathematical Foundation
The entire tool is built upon the Fibonacci sequence. This sequence starts with 0 and 1, and each subsequent number is the sum of the two preceding ones.
The magic happens not in the numbers themselves, but in the ratios derived from them. As you go further into the sequence, the ratio of any number to the next one approaches approximately 0.618, and the ratio to the previous number approaches 1.618. This is known as the Golden Ratio, or Phi ().
The key ratios used in trading are derived as follows:
- The 61.8% Level (0.618): This is derived by dividing any number in the sequence by the number that immediately follows it (e.g., 55 / 89 ≈ 0.618). This is often considered the most important retracement level.
- The 38.2% Level (0.382): This is found by dividing any number in the sequence by the number two places to its right (e.g., 55 / 144 ≈ 0.382). It is also the result of .
- The 23.6% Level (0.236): This is derived by dividing any number by the number three places to its right (e.g., 34 / 144 ≈ 0.236).
Traders also use other levels:
- The 50% Level: While not a true Fibonacci number, it’s included because of the tendency for price to reverse after retracing half of the prior move, a concept central to Dow Theory.
- The 78.6% Level: The square root of 0.618, this is a deep retracement level.
- Extension Levels (161.8%, 261.8%): These are used for profit targets and are derived from the Golden Ratio (1.618) and its powers.
How to Calculate Fibonacci Levels
To apply the tool, you first need to identify a clear, recent price move, known as a “swing.” This is defined by a Swing Low (a bottom point) and a Swing High (a top point).
Let’s define:
- = The price at the Swing High
- = The price at the Swing Low
Calculation for an Uptrend
In an uptrend, the price moves from a low to a high and then starts to retrace downwards. The retracement levels act as potential support.
Example: Suppose NIFTY moves from a Swing Low of 18,000 to a Swing High of 18,500.
- Range = 18,500 – 18,000 = 500 points.
- 38.2% Retracement = 18,500 – (500 * 0.382) = 18,309.
- 50% Retracement = 18,500 – (500 * 0.50) = 18,250.
- 61.8% Retracement = 18,500 – (500 * 0.618) = 18,191.
Calculation for a Downtrend
In a downtrend, the price moves from a high to a low and then starts to retrace upwards. The retracement levels act as potential resistance.
Example: Suppose BANKNIFTY moves from a Swing High of 44,000 to a Swing Low of 43,000.
- Range = 44,000 – 43,000 = 1,000 points.
- 38.2% Retracement = 43,000 + (1000 * 0.382) = 43,382.
- 50% Retracement = 43,000 + (1000 * 0.50) = 43,500.
- 61.8% Retracement = 43,000 + (1000 * 0.618) = 43,618.
Drawing and Reading Fibonacci Levels
All modern charting platforms have a built-in Fibonacci drawing tool. The key is to apply it correctly.
Case for an Uptrend
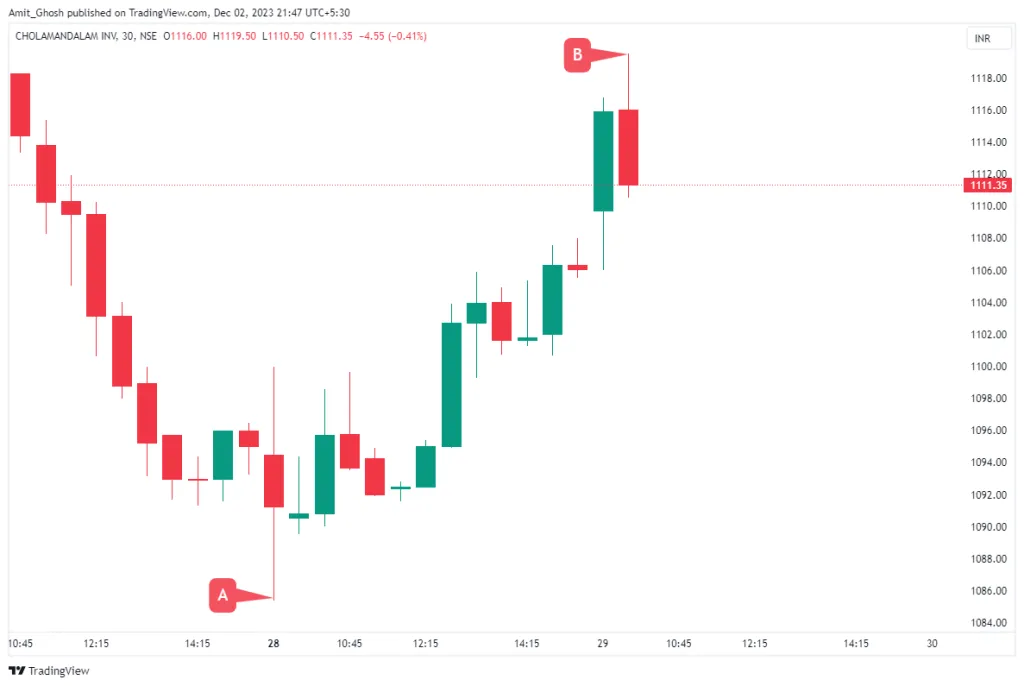
1. Identify a clear Swing Low (point A) and a subsequent Swing High (point B).
2. Select the Fibonacci tool.
3. Click on the Swing Low (A) and drag your cursor to the Swing High (B), then release.
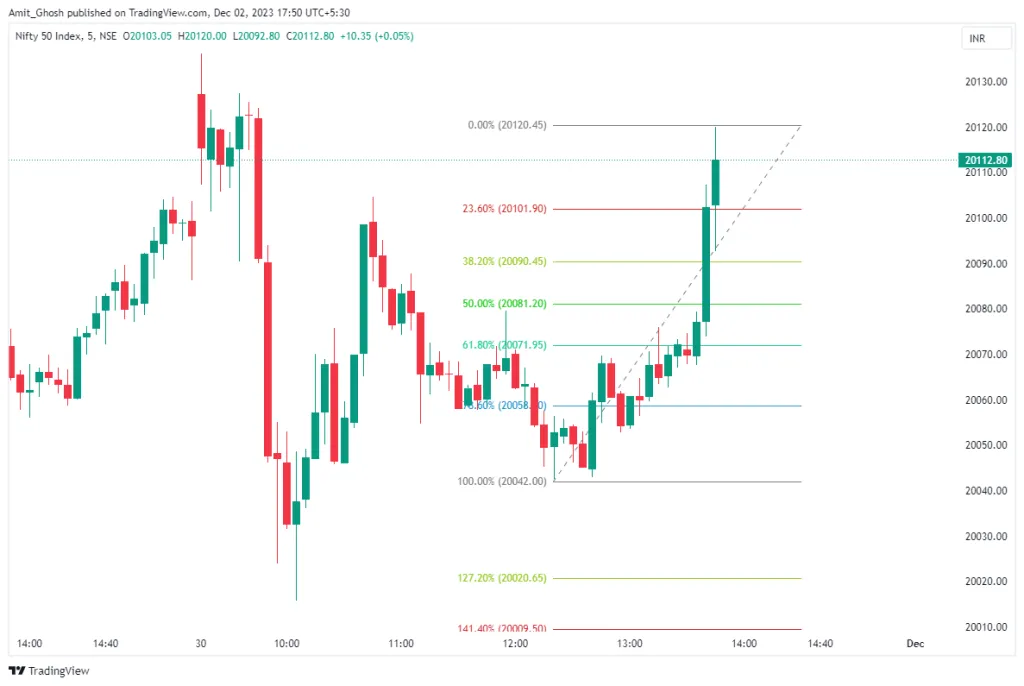
The tool will automatically plot the levels. The 100% level will be at the Swing Low (A) and the 0% level will be at the Swing High (B).
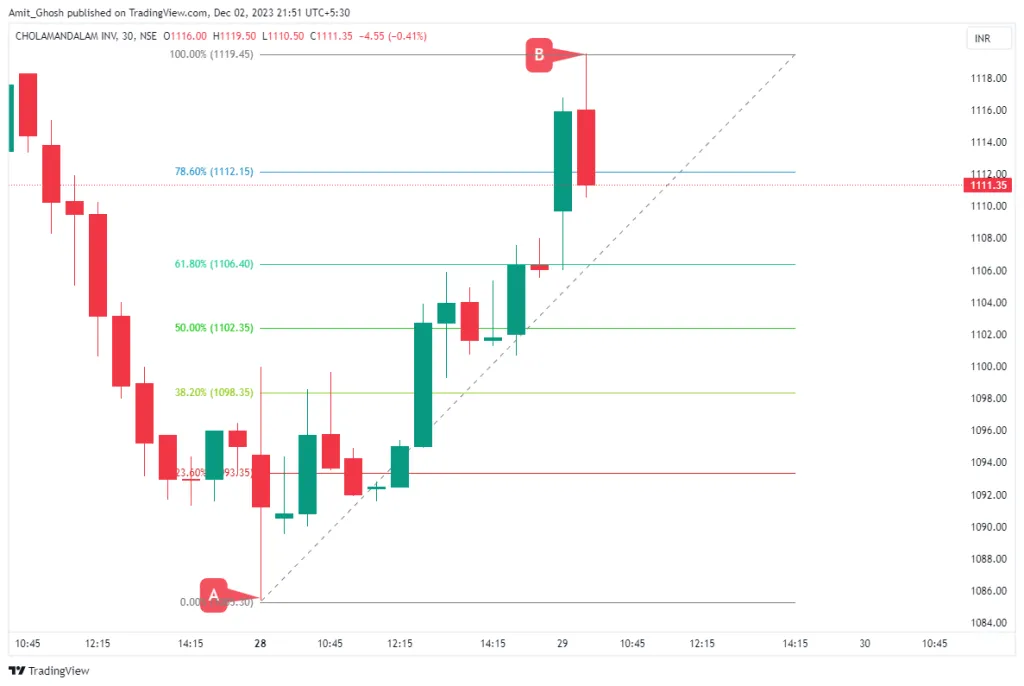
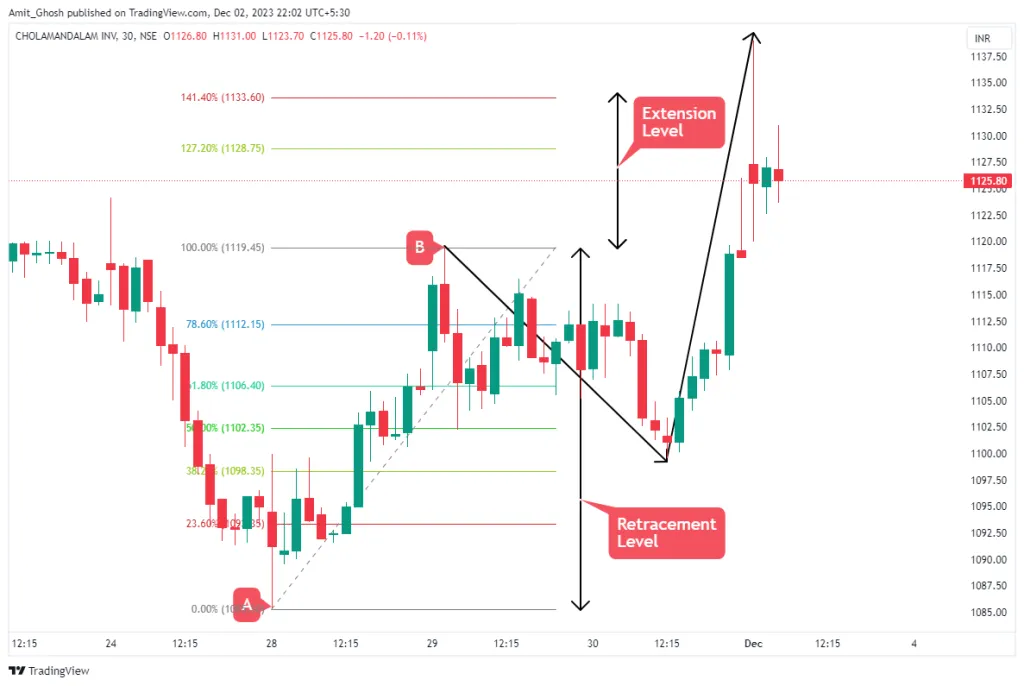
- Retracement Levels: The lines between 0% and 100% (23.6%, 38.2%, 50%, 61.8%, 78.6%). These are potential support zones where you might look for a long entry.
- Extension Levels: The lines above the 0% level (127.2%, 138.2%, 161.8%, etc.). These are potential profit targets.
As you can see below, the price retraced to the 38.2% level, found support, and then continued upwards towards the extension levels.
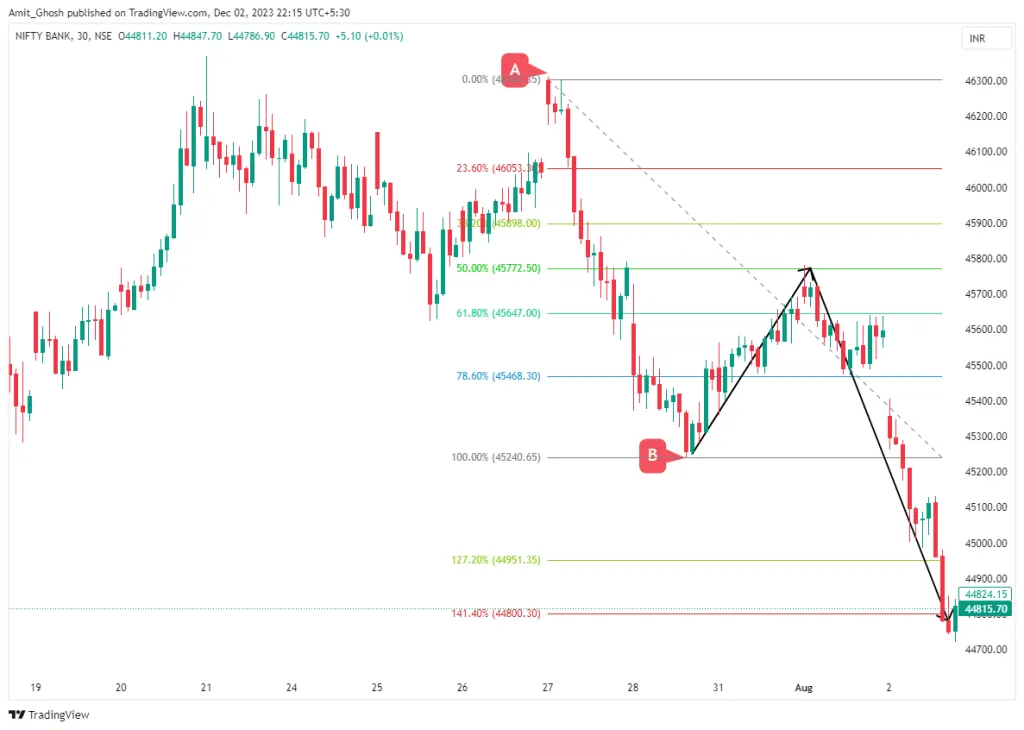
Case for a Downtrend
The process is identical but inverted.
1. Identify a clear Swing High (A) and a subsequent Swing Low (B).
2. Select the Fibonacci tool.
3. Click on the Swing High (A) and drag your cursor to the Swing Low (B), then release.
The 100% level will be at the Swing High (A) and the 0% level at the Swing Low (B). The retracement levels now act as potential resistance for short entries.
Why Do Fibonacci Levels Work?
The primary reason Fibonacci levels are effective is that they have become a self-fulfilling prophecy. A vast number of retail and institutional traders, as well as algorithms, are programmed to watch these levels. When price approaches a key Fibonacci ratio, legions of traders place buy or sell orders, creating actual support or resistance and validating the level.
Trading with Fibonacci Levels
Fibonacci levels are not a standalone strategy but a powerful tool to enhance one. Here are its primary trading uses:
- Trend Continuation Entries: Entering a trade in the direction of the primary trend when the price pulls back to a Fibonacci support or resistance level.
- Setting Price Targets: Using Fibonacci extension levels to determine logical exit points for a trade.
- Placing Stop-Loss Orders: Setting a stop-loss just beyond a Fibonacci level to limit risk if the level fails to hold.
- Finding Confluence: Combining Fibonacci levels with other indicators (like Moving Averages, Pivot Points, or Bollinger Bands) to identify high-probability trade zones.
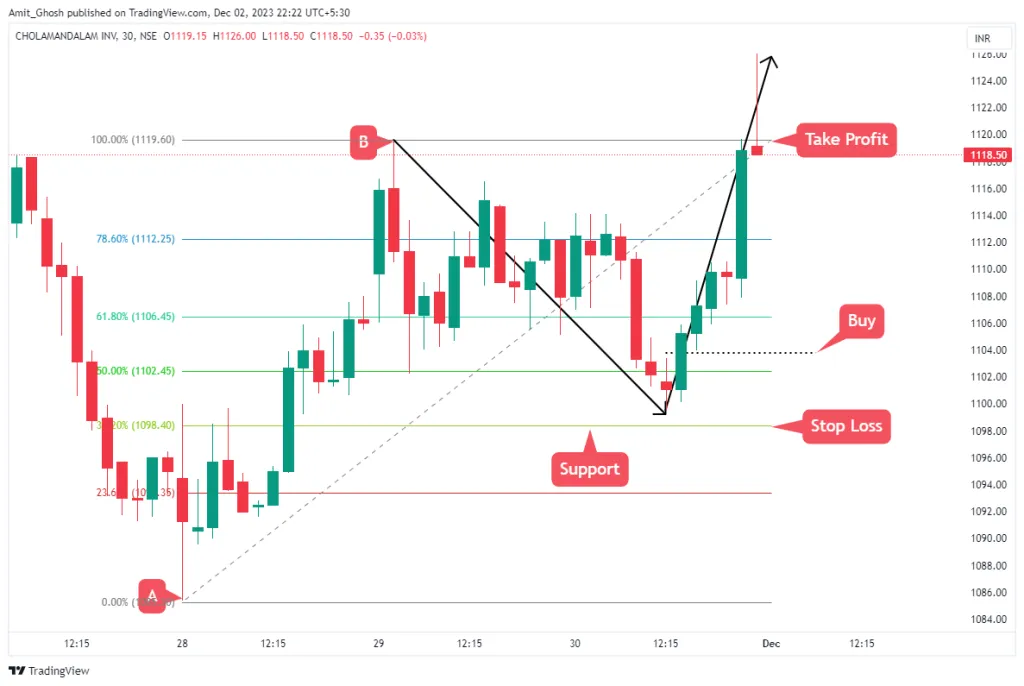
Entry in an Uptrend
Wait for the price to pull back to a retracement level and show signs of finding support. This could be a bullish candlestick pattern (like a hammer or engulfing pattern) forming at the level.
- Entry: Enter a long trade once the price confirms the support and starts moving up again.
- Stop-Loss: Place the stop-loss just below the low of the candlestick that tested the Fibonacci level, or below the level itself.
- Profit Target: Use the Fibonacci extension levels as potential targets.
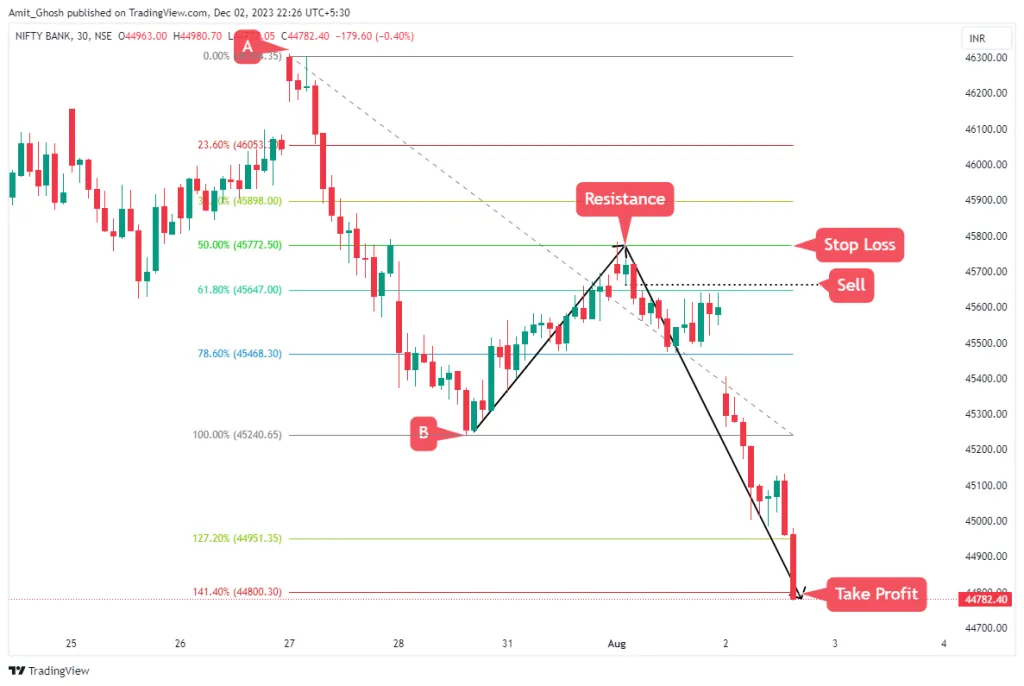
Entry in a Downtrend
The logic is reversed. Wait for price to pull back up to a resistance level and show signs of rejection (e.g., a shooting star or bearish engulfing pattern).
- Entry: Enter a short trade once the price confirms the resistance.
- Stop-Loss: Place the stop-loss just above the high of the candlestick that tested the level.
- Profit Target: Use the Fibonacci extension levels below the swing low.
Using Fibonacci Extensions for Targets
There is an observed correlation between how deep a retracement is and how far the subsequent extension goes.
| If Price Retraces To… | It Often Extends To… |
|---|---|
| 38.2% | 138.2% Extension |
| 50.0% or 61.8% | 161.8% Extension |
This relationship provides a systematic way to set profit targets. If you enter a long trade at the 50% retracement level, a logical first target would be the 161.8% extension level.
Best Timeframes for Indian Markets
While Fibonacci is universal, its effectiveness can vary by timeframe and instrument. For the Indian markets:
- NIFTY & BANKNIFTY Futures: The 15-minute and 75-minute charts often provide the clearest swings and most respected levels for intraday and swing trading.
- Large-Cap Stocks (e.g., RELIANCE, HDFCBANK): The Daily and Hourly charts are excellent for identifying major trend retracements for swing and positional trades. The signals are generally cleaner and less prone to noise than on very low timeframes.
Conclusion
You have learned that the Fibonacci tool is a versatile method for identifying potential support and resistance zones based on a mathematical sequence.
- It is applied by drawing from a swing low to a swing high in an uptrend, and vice-versa in a downtrend.
- Retracement levels (38.2%, 50%, 61.8%) are zones for potential trade entries.
- Extension levels (138.2%, 161.8%) are zones for potential profit targets.
- Its effectiveness stems largely from its widespread use, making it a self-fulfilling prophecy.
Remember, Fibonacci levels are zones, not exact lines. And most importantly, they should always be used in confluence with other forms of analysis—such as candlestick patterns, moving averages, or momentum oscillators—to confirm a trade setup. Never use it in isolation.