Trend Insights with Parabolic SAR

Understanding the Parabolic SAR Indicator
The Parabolic Stop and Reverse (SAR) is a trend-following indicator developed by J. Welles Wilder Jr., a titan in the world of technical analysis. It was first introduced in his seminal 1978 book, “New Concepts in Technical Trading Systems,” the same work that gave us the Relative Strength Index (RSI) and the Average Directional Index (ADX). The primary purpose of the Parabolic SAR is to identify the direction of a trend and, more importantly, to provide signals for when that trend may be reversing.
On a price chart, the indicator appears as a series of dots, or steps, that trail the price action. This “parabolic” trail is the source of its name and its core utility.
Reading the SAR Dots
The interpretation of the Parabolic SAR is straightforward and visual, making it a favourite among traders who prefer clean charts.
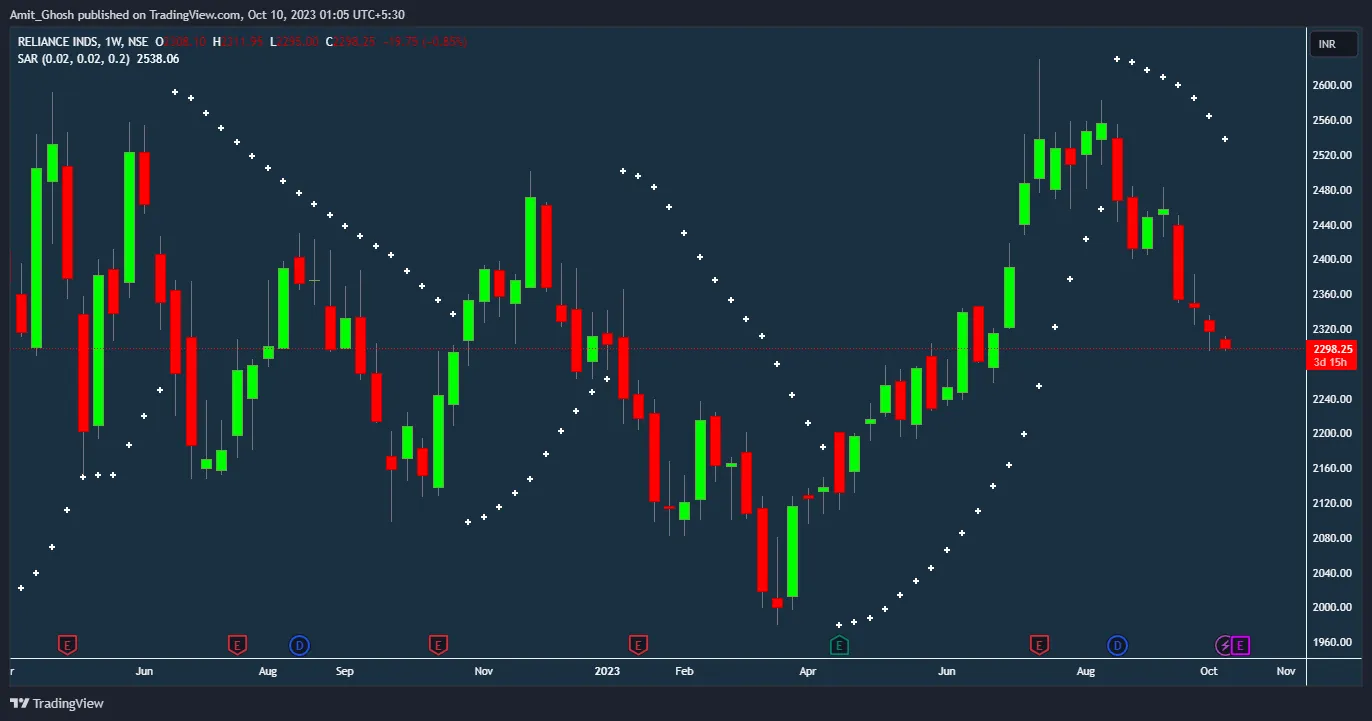
- Uptrend: When the SAR dots are positioned below the candlesticks, it signifies that the prevailing trend is bullish. The indicator trails the price upwards, acting as a dynamic support level.
- Downtrend: When the SAR dots are positioned above the candlesticks, it indicates a bearish trend. Here, the indicator trails the price downwards, serving as a dynamic resistance level.
The “Stop and Reverse” part of the name comes from the moment the price touches and crosses the SAR dots. This event triggers a “flip,” where the dots switch from one side of the price to the other, signalling a potential end to the current trend and the beginning of a new one.
The Mathematical Engine of Parabolic SAR
To truly master the SAR, it’s essential to understand its underlying calculation. The indicator is not a simple moving average; it incorporates an “Acceleration Factor” that makes it more responsive as a trend matures. The core formula is iterative, meaning each period’s SAR value depends on the previous one.
The SAR Formula
The calculation differs slightly for rising and falling trends.
For an uptrend (Rising SAR):
For a downtrend (Falling SAR):
Where:
- is the SAR value for the next period.
- is the SAR value for the current period.
- is the Extreme Point. In an uptrend, this is the highest high recorded since the trend began. In a downtrend, it’s the lowest low.
- is the Acceleration Factor (AF). This is the component that gives the SAR its unique behaviour.
The Acceleration Factor ()
The AF controls the sensitivity of the indicator. Wilder recommended the following parameters:
- Starting Value: The AF typically starts at 0.02.
- Increment: Each time a new Extreme Point (a new high in an uptrend or new low in a downtrend) is made, the AF increases by a step of 0.02.
- Maximum Value: The AF is capped at a maximum value, typically 0.20. It does not increase beyond this point, no matter how many new EPs are made.
This dynamic AF means that the SAR starts moving slowly, giving the trend room to establish itself. As the trend progresses and gains momentum (by making new EPs), the SAR accelerates, catching up to the price action more quickly. This built-in acceleration ensures that the indicator becomes more sensitive as the trend gets older and is more likely to be nearing its exhaustion point.
A Numerical Example with NIFTY
Let’s walk through a simplified, synthetic NIFTY uptrend to see the calculation in action. We’ll assume the trend has just begun.
Initial parameters: Starting AF = 0.02, Maximum AF = 0.20.
The first SAR value is simply the previous trend’s EP (the lowest low of the prior downtrend). Let’s assume this was 17,500.
| Day | High | Low | Trend | EP | AF () | SAR Calculation | SARt+1 |
|---|---|---|---|---|---|---|---|
| 1 | 17,600 | 17,520 | Uptrend | 17,600 | 0.02 | Initial SAR | 17,500 |
| 2 | 17,650 | 17,580 | Uptrend | 17,650 | 0.04 | 17500 + 0.02(17600 – 17500) | 17,502 |
| 3 | 17,720 | 17,640 | Uptrend | 17,720 | 0.06 | 17502 + 0.04(17650 – 17502) | 17,507.92 |
| 4 | 17,700 | 17,660 | Uptrend | 17,720 | 0.06 | 17507.92 + 0.06(17720 – 17507.92) | 17,520.64 |
| 5 | 17,780 | 17,710 | Uptrend | 17,780 | 0.08 | 17520.64 + 0.06(17720 – 17520.64) | 17,532.60 |
Analysis of the calculation:
- Day 2: A new high of 17,650 is made, so EP updates. Since a new EP was set, the AF increases from 0.02 to 0.04. The next SAR is calculated using the old SAR, the new AF, and the old EP.
- Day 3: Another new high at 17,720. EP updates, and AF increments to 0.06.
- Day 4: The high (17,700) does not exceed the current EP (17,720). Therefore, the EP remains unchanged, and crucially, the AF also remains at 0.06. The SAR continues to rise, but the rate of acceleration has paused.
- Day 5: A new high at 17,780 breaks the old EP. The EP updates, and the AF increments to 0.08.
Practical Application in Trading
While understanding the math is beneficial, the real value lies in its application on live charts. The SAR has three primary uses: trend identification, generating entry/exit signals, and managing trailing stop-losses.
1. Identifying and Following Trends
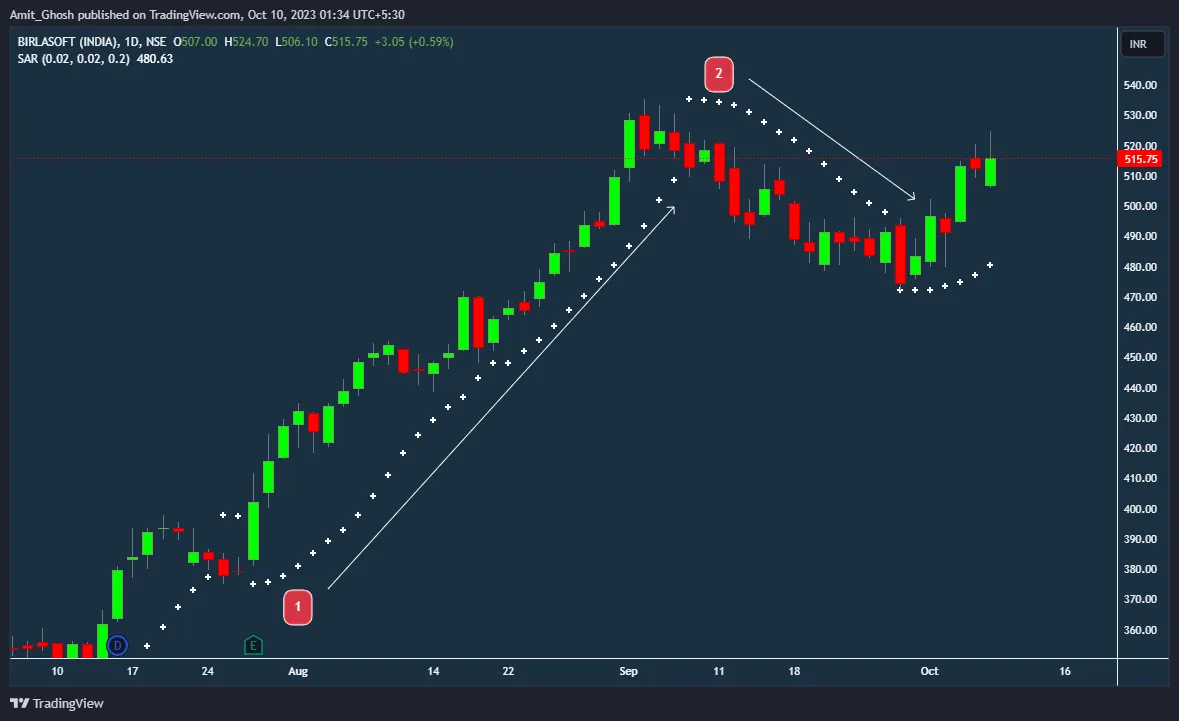
As a trend-following indicator, SAR excels in markets with clear, sustained directional moves. In the BANKNIFTY chart below, notice how the SAR dots remain cleanly below the price during the strong upward rally, providing a clear visual confirmation of the bullish trend.
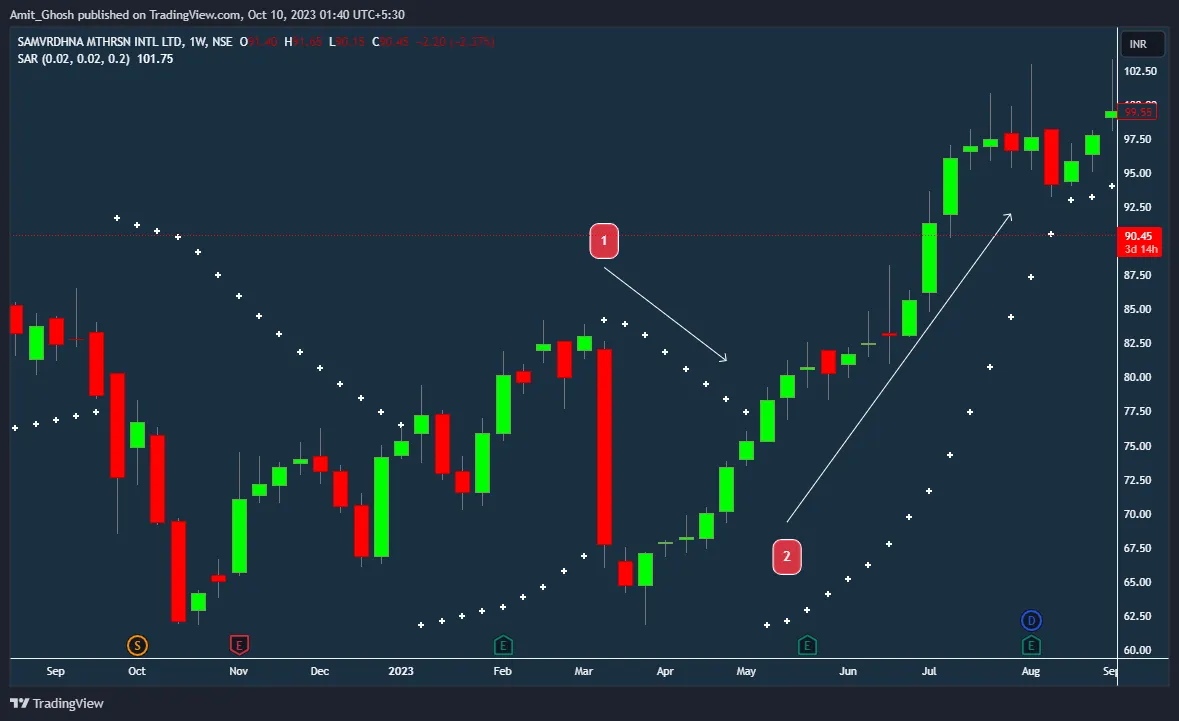
When the price eventually crosses below the SAR dot, the indicator flips above the price, signalling that the uptrend’s momentum has broken and a potential downtrend is beginning.
2. Entry and Exit Signals
The flip of the SAR dots is the primary signal for entry and exit.
- Buy Signal: A flip from above the price to below the price suggests bearish momentum is fading and a new uptrend may be starting. Traders might consider this a signal to enter a long position.
- Sell/Short Signal: A flip from below the price to above the price indicates bullish momentum is exhausted, and a new downtrend could be emerging. This can be a signal to exit a long position or enter a short position.
However, it is rarely advisable to take these signals in isolation. A confirmation from price action (e.g., a bullish engulfing candle on a buy signal) or another indicator can significantly improve signal quality.
3. Dynamic Trailing Stop-Loss
Perhaps the most powerful application of the Parabolic SAR is as a dynamic trailing stop-loss. This automates the process of protecting profits in a winning trade.
The Method:
- Enter a long trade based on your strategy (e.g., a breakout confirmed by a SAR flip).
- Place your initial stop-loss based on your risk management rules.
- For each new period that the trade is open, move your stop-loss up to the level of the previous period’s SAR dot.
- Continue to trail the stop-loss with the SAR until the price reverses and hits your stop, locking in the accumulated profit.
In conclusion, the Parabolic SAR is a versatile and intuitive tool for the trend trader. By understanding its mathematical construction and its practical applications for identifying trends, timing entries, and managing exits, a trader can effectively integrate it into their system. Its effectiveness is highest in strongly trending instruments, common in Indian large-cap stocks and indices, but it must be used with caution and preferably with a confirming indicator to avoid the pitfalls of choppy, non-trending markets.