CCI Indicator

The Commodity Channel Index (CCI), developed by Donald Lambert, is a versatile momentum-based oscillator used to identify cyclical trends in an asset’s price. Unlike many other oscillators, the CCI is unbounded, meaning it has no upper or lower limit. Its primary purpose is to measure the current price level relative to an average price level over a specified period. This helps traders identify overbought and oversold conditions, as well as the strength and direction of a trend.
In this lesson, you will learn:
- The mathematical formula behind the CCI indicator.
- How to calculate and interpret CCI values for trading decisions.
- Effective strategies for using the CCI in various market conditions, including reversals and divergences.
- How to adjust CCI settings for different timeframes and trading styles, particularly within the context of Indian markets.
The CCI Formula
The CCI calculation involves three main components: the Typical Price (TP), a Simple Moving Average (SMA) of the Typical Price, and the Mean Deviation (MD) from that average.
1. Typical Price (TP)
First, we calculate the Typical Price for each period, which is the arithmetic mean of the high, low, and close prices.
2. Simple Moving Average of Typical Price (SMATP)
Next, we calculate an n-period Simple Moving Average of the Typical Price. The standard lookback period (n) is 20, though 14 is also commonly used in many charting platforms.
3. Mean Deviation (MD)
Then, we calculate the n-period Mean Deviation. This measures the average absolute difference between the Typical Price of each period and its n-period SMA.
4. The Final CCI Calculation
Finally, the CCI is calculated by taking the difference between the most recent Typical Price and its SMA, dividing it by the Mean Deviation, and then multiplying by a constant factor of 0.015.
How to Read the CCI Indicator
The CCI line oscillates above and below a zero line, with two key levels at +100 and -100.
- Overbought Condition (> +100): When the CCI moves above the +100 level, it indicates that the price is trading well above its historical average. This suggests strong upward momentum, but also warns that the asset might be overextended and due for a price correction or consolidation.
- Oversold Condition (< -100): When the CCI drops below the -100 level, it signifies that the price is trading significantly below its historical average. This indicates strong downward momentum and suggests the asset could be oversold and poised for a potential bounce.
- Zero Line: The zero line represents the level where the price is in equilibrium with its moving average. A CCI value above zero indicates that the price is above its moving average, suggesting bullish sentiment. A value below zero suggests bearish sentiment.
Trading Strategies with CCI
The CCI can be used in several ways to generate trading signals.
1. Overbought/Oversold Reversals
This is the most common way to trade with the CCI. The strategy is not to trade simply because the indicator is overbought or oversold, but to wait for a confirmation of a reversal.
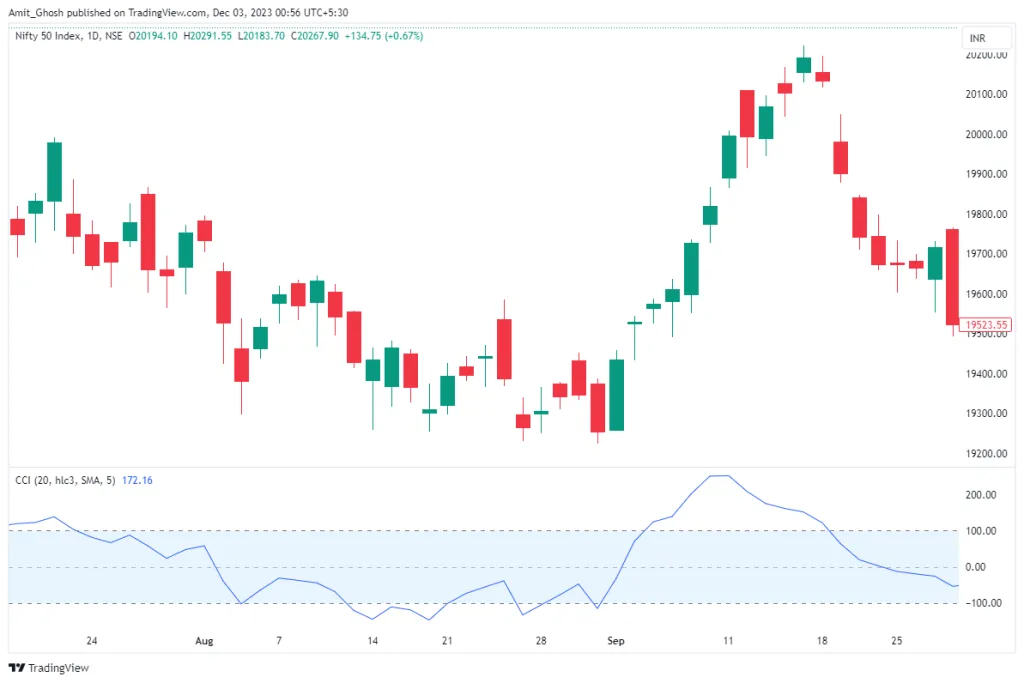
- Sell Signal: Wait for the CCI to move above +100 (confirming an overbought condition). The sell signal is generated when the CCI line crosses back down below the +100 level. This suggests that the bullish momentum is fading and a reversal may be imminent.
- Buy Signal: Wait for the CCI to move below -100 (confirming an oversold condition). The buy signal occurs when the CCI line crosses back up above the -100 level, indicating that bearish momentum is waning.
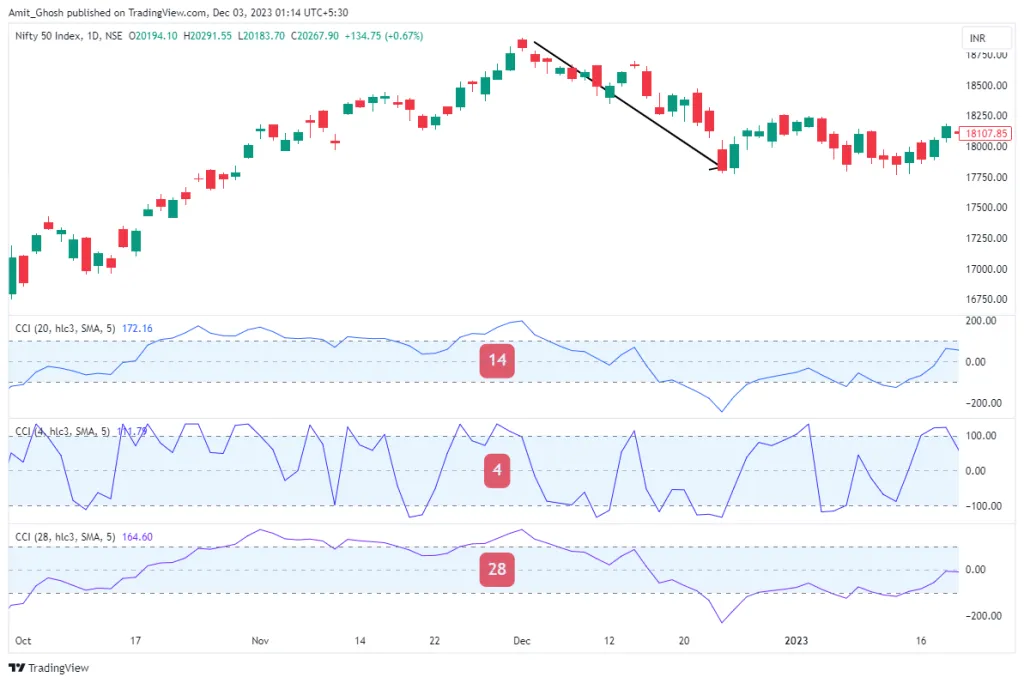
In the chart above, the CCI crosses above +100, signalling an overbought market. A potential short entry is triggered when the CCI line reverses and crosses back below +100.
2. Divergence Trading
Divergence is a powerful concept where the indicator’s movement diverges from the price action, often signalling a pending reversal.
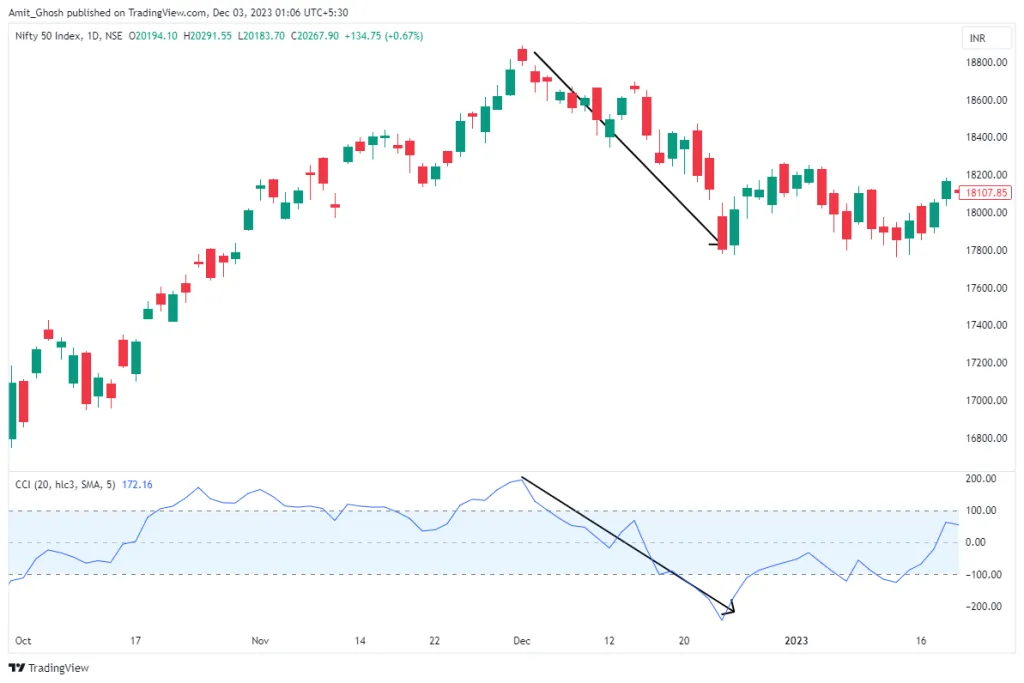
- Bearish Divergence: Occurs when the price prints a new higher high, but the CCI fails to make a new higher high and instead prints a lower high. This indicates that the upward momentum is weakening despite the new price high, and a reversal to the downside is possible.
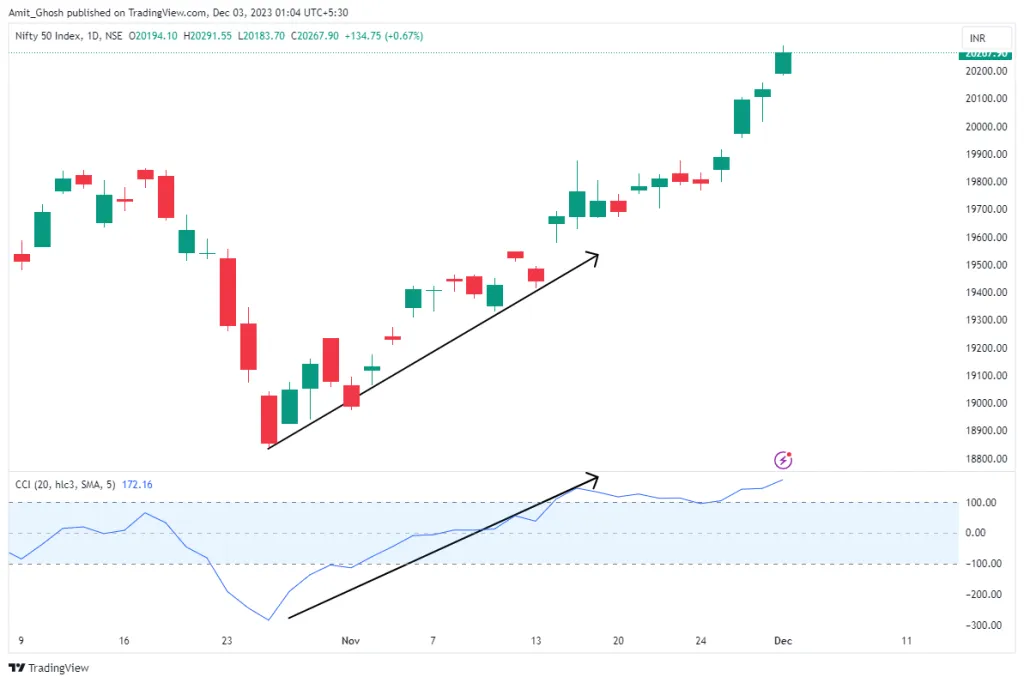
- Bullish Divergence: Occurs when the price makes a new lower low, but the CCI prints a higher low. This suggests that the downward momentum is fading, and the price might be getting ready to reverse to the upside.
3. Trend Confirmation with the Zero Line
The zero line can act as a simple filter for trend direction.
- An uptrend can be considered intact as long as the CCI remains above the zero line.
- A downtrend is confirmed when the CCI stays below the zero line.
Traders can use a cross of the zero line as a basic entry or exit signal. For instance, a cross above zero can be a buy signal in a long-term uptrend, while a cross below zero can be a sell or short signal in a downtrend.
Changing the CCI Indicator Settings
The default setting for the CCI is typically 20 periods, although some platforms use 14. Adjusting this setting changes the indicator’s sensitivity.
Lower CCI Settings (e.g., 4-10 periods):
A shorter lookback period makes the CCI more sensitive to recent price changes. This results in a more volatile oscillator that crosses the +100 and -100 levels more frequently.
- Advantage: Can provide earlier entry signals, potentially leading to larger profits if the trend materializes.
- Disadvantage: Generates more signals, many of which can be false signals or “whipsaws,” especially in choppy markets.
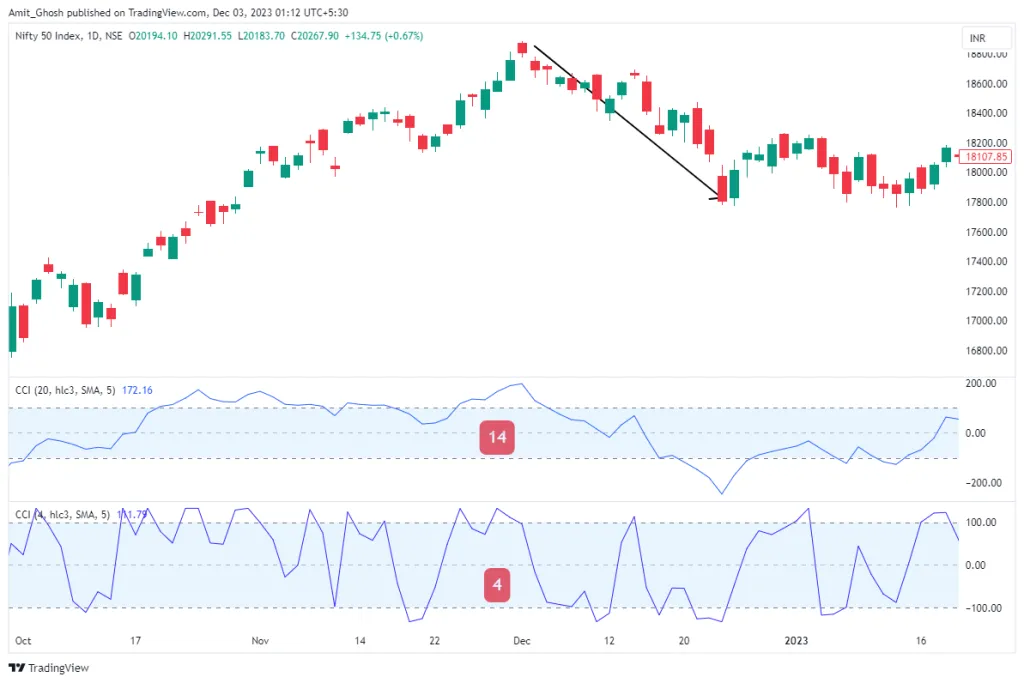
Higher CCI Settings (e.g., 50-100 periods):
A longer lookback period smooths out the CCI line, making it less sensitive. It will cross the +100 and -100 levels much less frequently but will tend to stay in those zones for longer when it does.
- Advantage: Filters out market noise and reduces the number of false signals. It is better for identifying longer-term trends.
- Disadvantage: Signals are generated later, which may result in delayed entries and smaller profits.
Best Timeframes for Indian Markets
The optimal CCI setting and timeframe depend on your trading style. For stocks and indices on the National Stock Exchange (NSE):
- Intraday Trading: For trading NIFTY, BANKNIFTY, or highly liquid stocks like RELIANCE or HDFCBANK on a short-term basis, the 5-minute and 15-minute charts are effective. A standard CCI(20) provides a good balance of responsiveness and reliability on these timeframes.
- Swing Trading: For holding positions over several days to weeks, the 60-minute (hourly) and daily charts are preferable. On a daily chart, a longer CCI period, such as CCI(50), can be very useful for identifying the primary, more dominant trend, helping you to only take trades in that direction.
As with any indicator, it is crucial to backtest any changes to the CCI settings to ensure they align with your trading strategy and improve your results in the specific market conditions you are trading.