Stochastic Indicator

In this lesson, you will learn:
- The mathematical foundation of the Stochastic Oscillator and its components, %K and %D.
- How to interpret overbought and oversold conditions to anticipate potential market reversals.
- How to identify high-probability trade signals using crossovers and divergences.
- Practical trading strategies and common pitfalls to avoid when using the indicator.
- How to adjust the indicator’s settings for different market conditions and timeframes, specifically within the context of Indian markets.
What is the Stochastic Indicator?
The Stochastic Oscillator is a momentum indicator developed by George C. Lane in the late 1950s. Its primary function is not to follow price or volume, but to gauge the speed and momentum of price changes. The core principle is that as prices increase, the closing prices tend to be closer to the high of the recent price range. Conversely, in a downtrend, closing prices tend to be nearer the low of the range.
The oscillator helps traders identify potentially overbought or oversold conditions, signalling that a market might be due for a directional change.
- An overbought reading suggests that the recent buying momentum may be losing steam, and the market could be vulnerable to a correction or reversal to the downside.
- An oversold reading suggests that selling pressure may be dissipating, and the market could be poised for a rally or reversal to the upside.
The indicator consists of two lines, %K and %D, which oscillate between 0 and 100. These lines and their interaction within defined zones form the basis of most Stochastic-based trading strategies.
The Formula Behind the Stochastic Oscillator
The Stochastic Oscillator is typically displayed with two lines: the main %K line and a signal line called %D. There are three versions of the oscillator—Fast, Slow, and Full—but the Slow Stochastic is the most commonly used version on modern charting platforms. Let’s break down the calculation.
1. Raw Stochastic Value (%K)
The initial calculation produces the raw %K value. It measures the current closing price in relation to the highest high and lowest low over a specified lookback period, typically 14 periods.
Where:
- Current Close (C): The most recent closing price.
- Lowest Lown: The lowest price recorded over the last ‘n’ periods.
- Highest Highn: The highest price recorded over the last ‘n’ periods.
- n: The lookback period (standard value is 14).
2. The Slow %K and %D Lines
Most charting software uses the “Slow Stochastic” by default, as it smooths out the raw calculation to produce more reliable signals.
The calculation proceeds as follows:
- The Fast %K is calculated by taking a 3-period simple moving average (SMA) of the %Kraw value. However, to simplify, modern platforms often refer to the raw value as the Fast %K. For clarity, let’s call the first smoothed value Slow %K.
- The Slow %K line is a 3-period SMA of the raw %K value. This line is often plotted as the main stochastic line and labeled as ‘%K’.
- The Slow %D line is a 3-period SMA of the Slow %K line. This acts as the signal line.
So, the standard (14, 3, 3) setting for a Slow Stochastic means:
- 14 periods for the Highest High and Lowest Low range.
- 3 periods for the SMA to create the Slow %K line.
- 3 periods for the SMA of Slow %K to create the %D signal line.
How to Read the Stochastic Oscillator
The indicator is bounded between 0 and 100 and is composed of three key zones.
- An overbought zone, typically above the 80 level.
- A neutral zone, between 20 and 80.
- An oversold zone, typically below the 20 level.
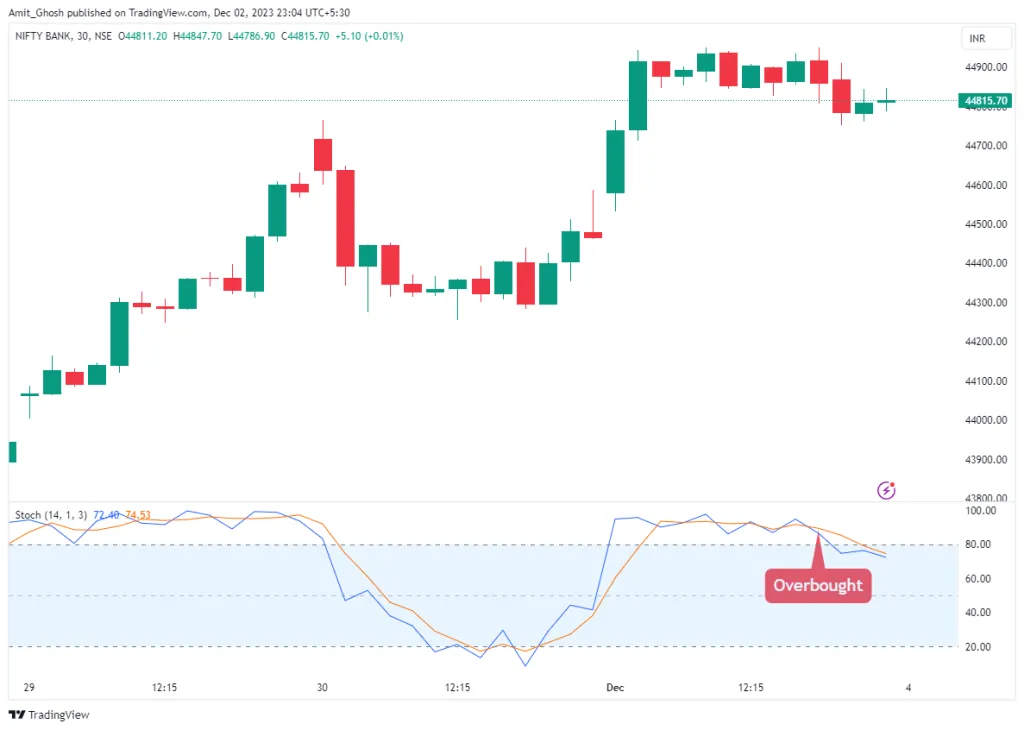
When price rallies sharply due to strong buying pressure, the indicator moves into the overbought zone (>80). This doesn’t automatically mean you should sell; it simply means the price is trading near the top of its recent range. It serves as an alert that the uptrend may be overextended and due for a pause or reversal.
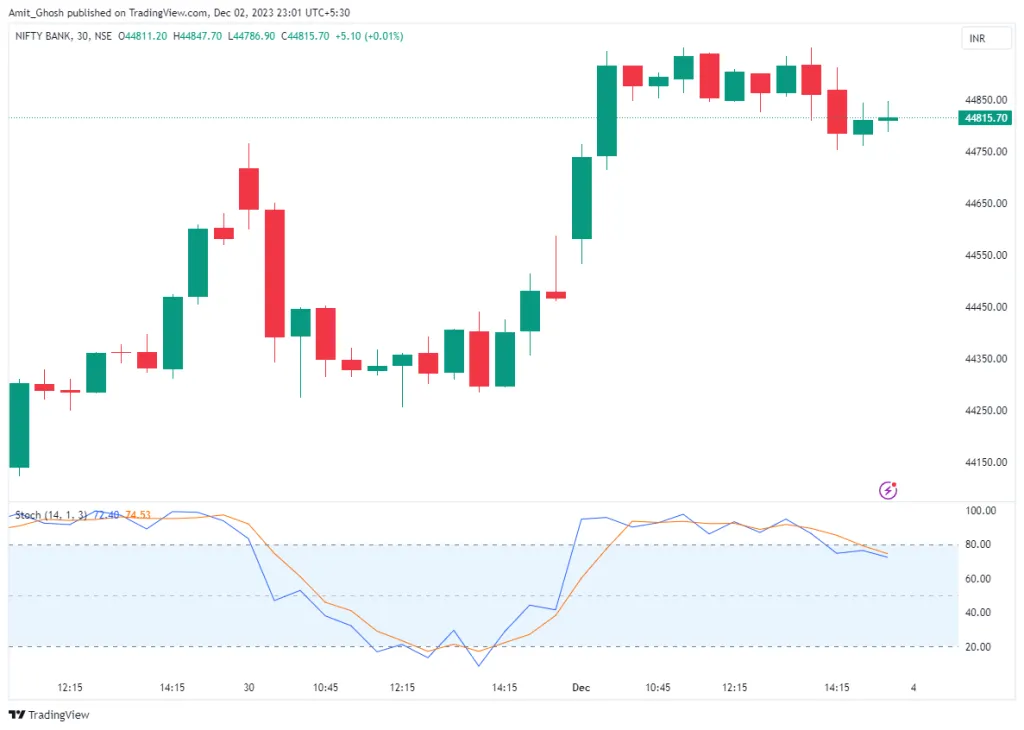
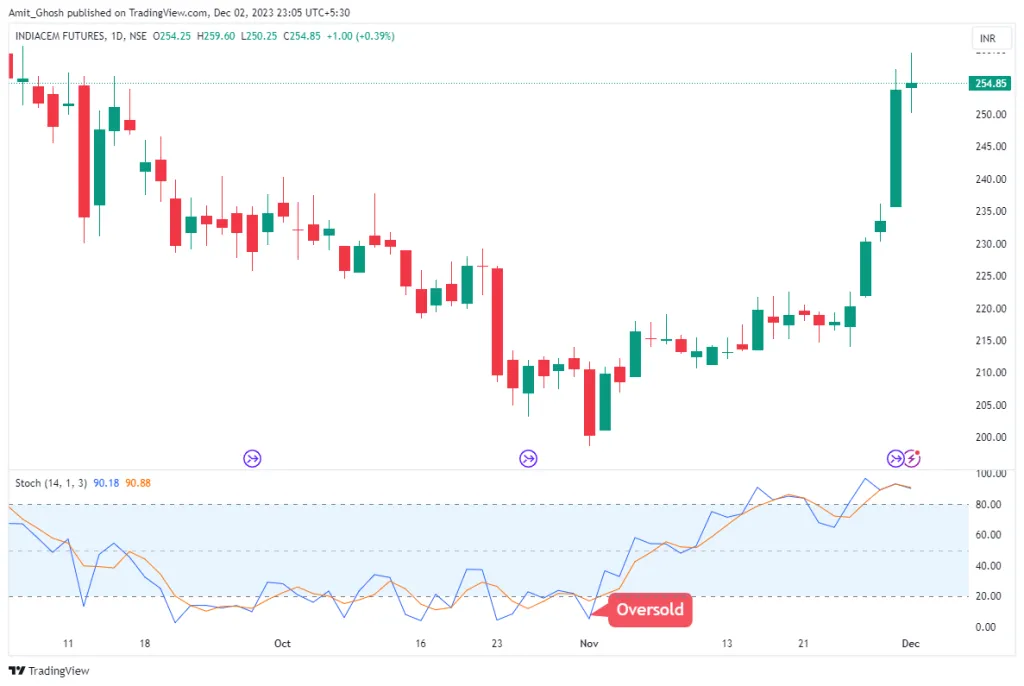
Conversely, when the price declines significantly due to excessive selling, the Stochastic will enter the oversold zone (<20). This alerts the trader that the security is trading near the bottom of its recent range and selling momentum could be exhausted, potentially leading to a bounce or reversal.
Trading Uses and Signals
The most effective way to use the Stochastic Oscillator is to wait for a confirmed signal rather than acting solely on an overbought or oversold reading.
1. Zone Exits and Crossovers
A common strategy is to wait for the indicator lines to exit the extreme zones.
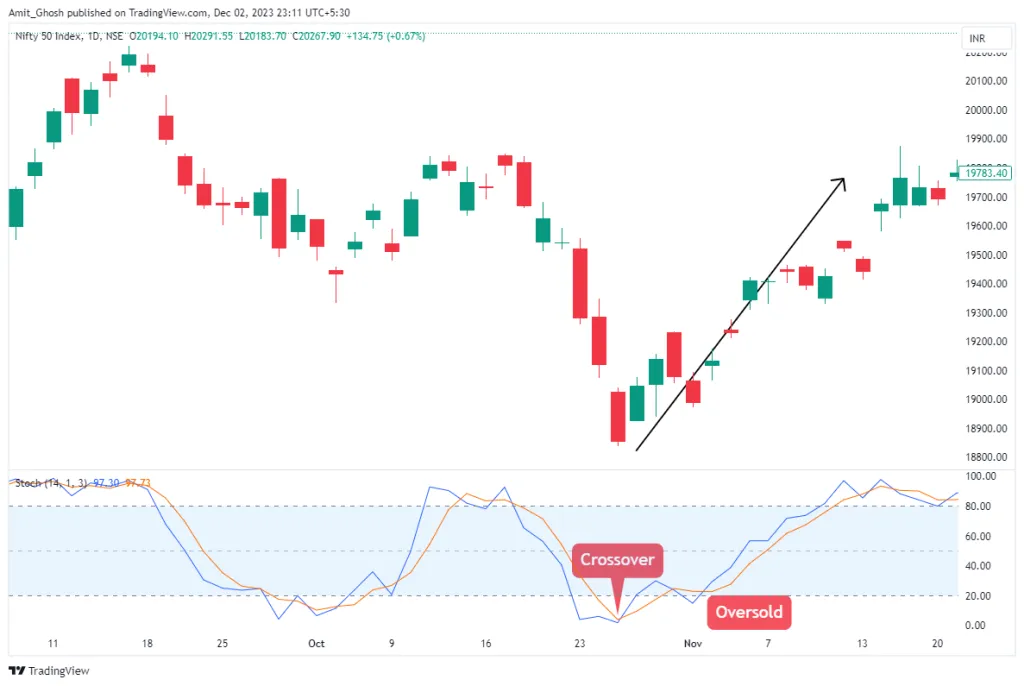
- A bullish signal occurs when the indicator has been in the oversold zone (<20) and then the %K line crosses above the %D line, with both lines subsequently rising above the 20 level. This suggests that downside momentum has faded and buyers are stepping in.
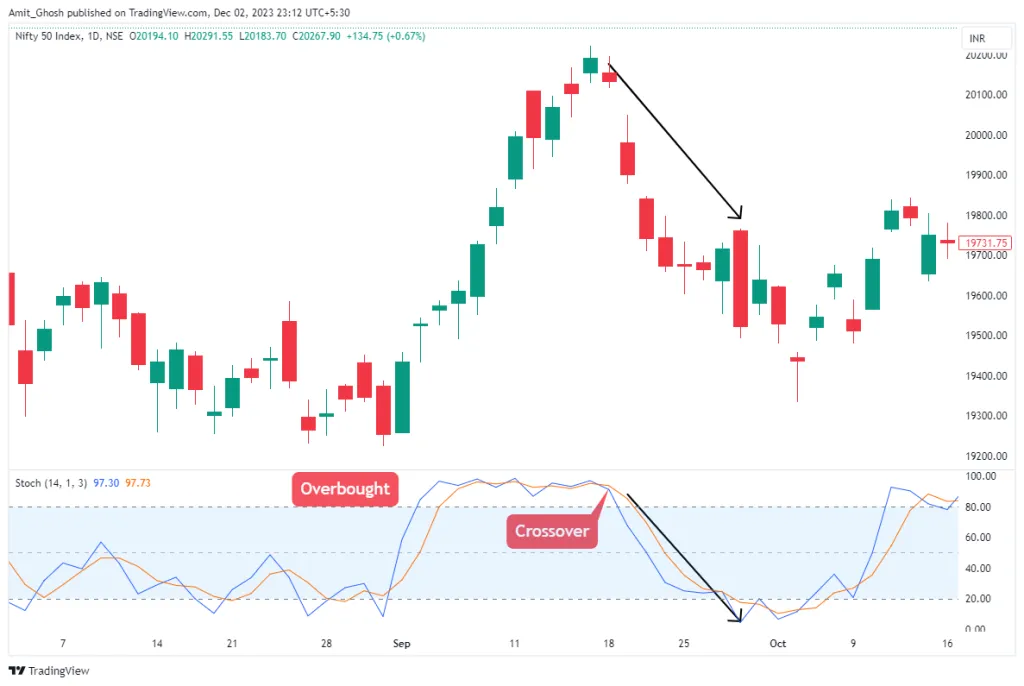
- A bearish signal occurs when the indicator has been in the overbought zone (>80) and then the %K line crosses below the %D line, with both lines then falling below the 80 level. This indicates that buying momentum is weakening and sellers are gaining control.
2. Bullish and Bearish Divergence
Divergence is a more advanced and powerful signal. It occurs when the price action and the oscillator move in opposite directions.
- Bullish Divergence: Price makes a lower low, but the Stochastic Oscillator makes a higher low. This indicates that despite the new price low, the downward momentum is weakening, and a potential reversal to the upside is possible.
- Bearish Divergence: Price makes a higher high, but the Stochastic Oscillator makes a lower high. This signals that buying momentum is fading even as price pushes higher, warning of a potential top and a reversal downwards.
Divergence signals are most reliable when they form after the indicator has been in an overbought or oversold zone.
Stochastic Oscillator Parameters
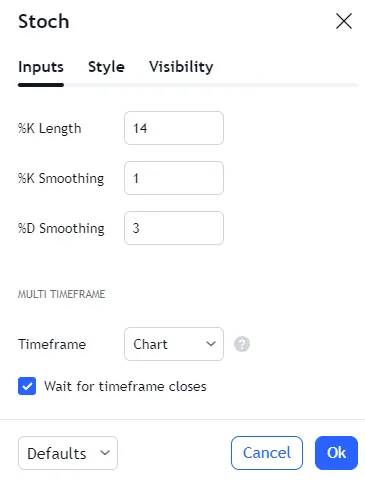
While the default settings of (14, 3, 3) are standard, traders can adjust them to suit their style.
- %K Period (14): This is the main lookback period. A shorter period (e.g., 5) will make the oscillator more sensitive to price changes, resulting in more signals but also more “whipsaws” or false signals. A longer period (e.g., 21) will smooth the oscillator, providing fewer, but potentially more reliable, signals.
- %K Smoothing (3): This is the period for the first SMA, which creates the Slow %K line. Increasing this value further smooths the indicator. This setting is often called ‘SmoothK’ or ‘Slowing’.
- %D Period (3): This is the period for the second SMA, which creates the %D signal line. A longer period here will create more lag between the %K and %D lines, resulting in fewer crossovers.
Aggressive settings (e.g., shorter periods) will generate more signals, allowing for earlier entries but also increasing the number of false signals. Conservative settings (longer periods) will lead to fewer, more delayed signals, which might cause missed opportunities but reduces noise. Any change in parameters must be thoroughly backtested to see if it improves your trading results.
Conclusion
You have learned that:
- The Stochastic Oscillator is a momentum indicator that compares a security’s closing price to its price range over a given period.
- It helps traders identify overbought (>80) and oversold (<20) conditions, which can signal potential price reversals.
- Reliable trade signals often come from crossovers of the %K and %D lines after they exit these extreme zones, or from bullish/bearish divergences with price.
- The indicator’s sensitivity can be adjusted by changing its parameters, but this involves a trade-off between signal frequency and reliability.
- Crucially, the Stochastic is most effective in ranging markets and should be used with caution in strong trends, always in conjunction with other forms of analysis.