Andrew´s Pitchfork Indicator

What is the Andrews Pitchfork?
The Andrews Pitchfork is a technical analysis tool developed by Dr. Alan Andrews that uses three parallel trendlines to identify potential levels of support and resistance, and thus forecast future price channels. It is based on the principles of physics and action-reaction, suggesting that price movements often exhibit a natural rhythm and tend to revert to a central pivot line.
When a market is trending up or down, the Pitchfork can delineate a clear channel in which the price is likely to move. This provides traders with predefined levels for entries, exits, and profit targets. It is a versatile tool used both for entering established trends and for anticipating market reversals.
The three parallel lines that constitute the Pitchfork are the Median Line (ML), the Upper Parallel Line (UPL), and the Lower Parallel Line (LPL).
The Mathematical Construction of the Pitchfork
The Andrews Pitchfork is drawn from three significant pivot points on a chart. These points are typically major turning points, like a swing high or swing low. Let’s label these points P₀, P₁, and P₂.
- For an uptrend: The points are a significant low (P₀), followed by a significant high (P₁), and then a subsequent significant low (P₂).
- For a downtrend: The points are a significant high (P₀), followed by a significant low (P₁), and then a subsequent significant high (P₂).
The construction follows these steps:
- The Median Line (ML): A line is first drawn from the initial pivot point (P₀). This line passes through the exact midpoint of the line segment connecting the second and third pivots (P₁ and P₂).
- The Upper and Lower Parallel Lines: Two additional lines are drawn parallel to the Median Line. One starts from the second pivot (P₁), and the other starts from the third pivot (P₂).
Let the three pivot points in time-price coordinates be , , and .
First, we find the midpoint of the segment connecting and :
The Median Line (ML) is the line that passes through points and . The slope of the Median Line determines the slope of the entire channel.
The Upper Parallel Line (UPL) and Lower Parallel Line (LPL) are then drawn parallel to the ML.
- In an uptrend (P₀=Low, P₁=High, P₂=Low), the UPL passes through P₁ and the LPL passes through P₂.
- In a downtrend (P₀=High, P₁=Low, P₂=High), the LPL passes through P₁ and the UPL passes through P₂.
How to Calculate an Example
Let’s take an example from NIFTY futures.
- Identify three consecutive pivots for an uptrend:
- P₀: A major low at 17,200.
- P₁: The next major high at 17,800.
- P₂: The following corrective low at 17,500.
- Calculate the Median Line’s target: Find the price midpoint between P₁ and P₂.
- Draw the Median Line: The central line starts from the P₀ price level (17,200) and is angled such that it passes through the price-time coordinate of the midpoint of P₁ and P₂.
- Draw the Parallel Lines: The Upper Parallel Line starts from P₁ (17,800) and runs exactly parallel to the Median Line. The Lower Parallel Line starts from P₂ (17,500) and also runs parallel to the Median Line.
The resulting channel provides a probable path for the future price action.
How to Draw the Andrews Pitchfork on a Chart
While understanding the manual calculation is useful, all modern charting platforms, like TradingView, provide a dedicated tool for drawing the Pitchfork.
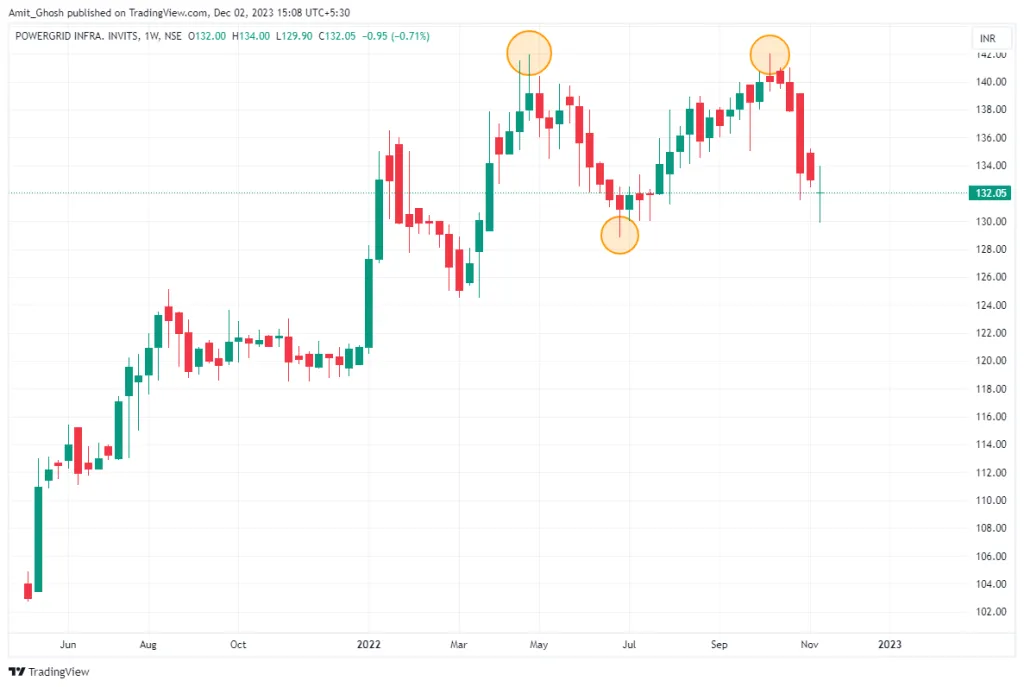
Step 1: Identify Three Consecutive Pivots
Look for clear, significant turning points on your chart. These are the highs and lows that stand out. For the tool to be effective, the chosen pivots must be significant; minor fluctuations will create unreliable channels.
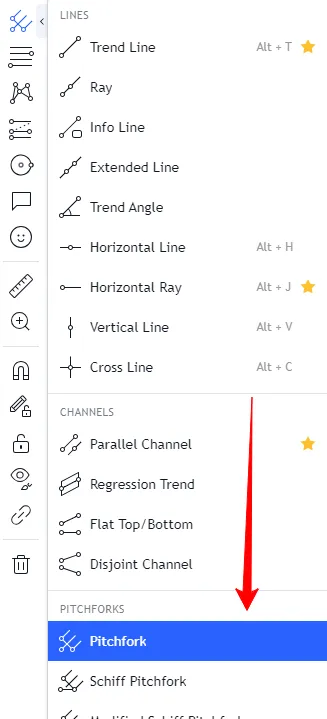
Step 2: Select the Pitchfork Tool
In your charting software’s drawing tools panel, you will find the Andrews Pitchfork. It is often grouped with Gann and Fibonacci tools.
Step 3: Plot the Points on the Chart
Click on each of the three pivot points in the correct sequence (P₀, then P₁, then P₂). The platform will automatically draw the Median Line and the two parallel channel lines.
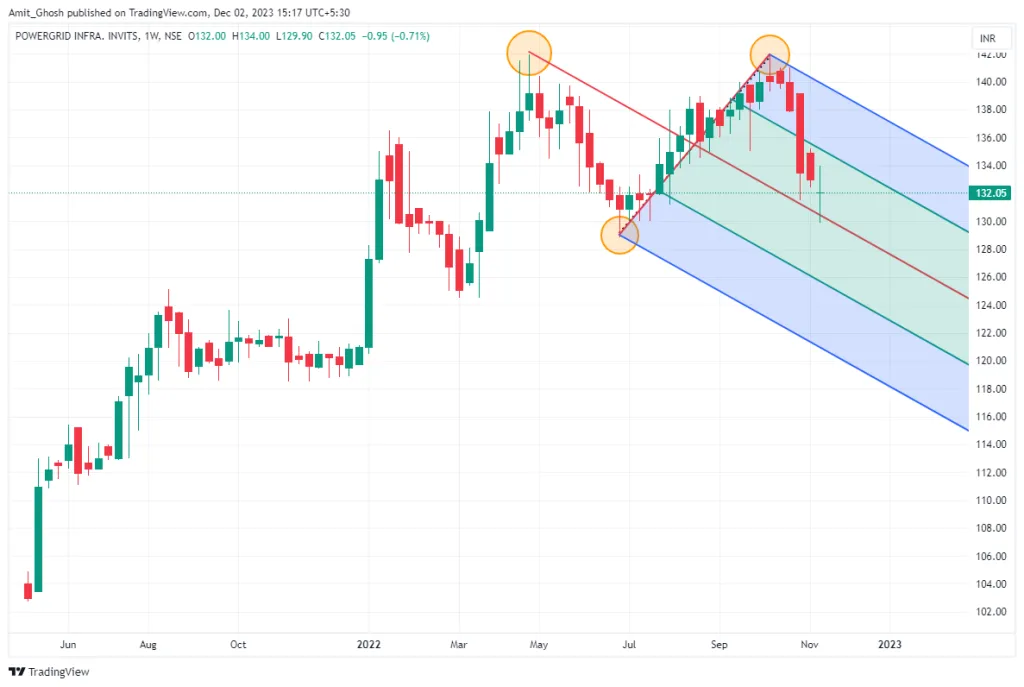
The resulting pitchfork is now ready for analysis.
How to Read and Interpret the Pitchfork
The core premise is that the price tends to gravitate towards the Median Line. The outer lines act as the primary boundaries of the trend.
| Component | Interpretation |
|---|---|
| Median Line (ML) | Acts as a price magnet. Price is expected to return to this line approximately 80% of the time. It can function as both support (in an uptrend) and resistance (in a downtrend). |
| Upper Parallel Line (UPL) | Acts as the primary resistance level in the channel. An overbought condition may be present when price reaches this line. |
| Lower Parallel Line (LPL) | Acts as the primary support level in the channel. An oversold condition may be present when price reaches this line. |
Dr. Andrews’ Trading Rules:
- There is a high probability (around 80%) that the price will reach the Median Line after reversing from one of the outer lines.
- When the price reaches the Median Line, it will often consolidate or reverse. A breakout through the ML suggests a move towards the opposite channel line.
- If the price fails to reach the Median Line after reversing from an outer line, it signals underlying strength (in an uptrend) or weakness (in a downtrend). The subsequent move is likely to be strong and fast.
- A decisive breakout beyond the Upper or Lower Parallel Lines signals a potential trend acceleration or a full trend reversal.
Trading Uses of the Andrews Pitchfork
The Pitchfork is not a standalone system, but a framework for identifying high-probability trade setups.
- Trend Following: For a long position in an uptrend, look for entries near the Lower Parallel Line, with the Median Line as the first profit target. For a short position in a downtrend, look for entries near the Upper Parallel Line, targeting the Median Line.
- Mean Reversion Scalping: In a strong trend, the price may trade between the Median Line and one of the outer lines. Traders can scalp by buying at the ML and selling at the UPL in a strong uptrend, or vice-versa in a downtrend.
- Breakout Trading: A sustained close outside the pitchfork channel can signal the end of the current trend and the beginning of a new one. A breakout above the UPL is a strong bullish signal, while a breakdown below the LPL is a strong bearish signal.
- Setting Stop-Loss Orders: A common strategy is to place a stop-loss just outside the pitchfork channel. For a long trade initiated at the LPL, the stop would go slightly below it.
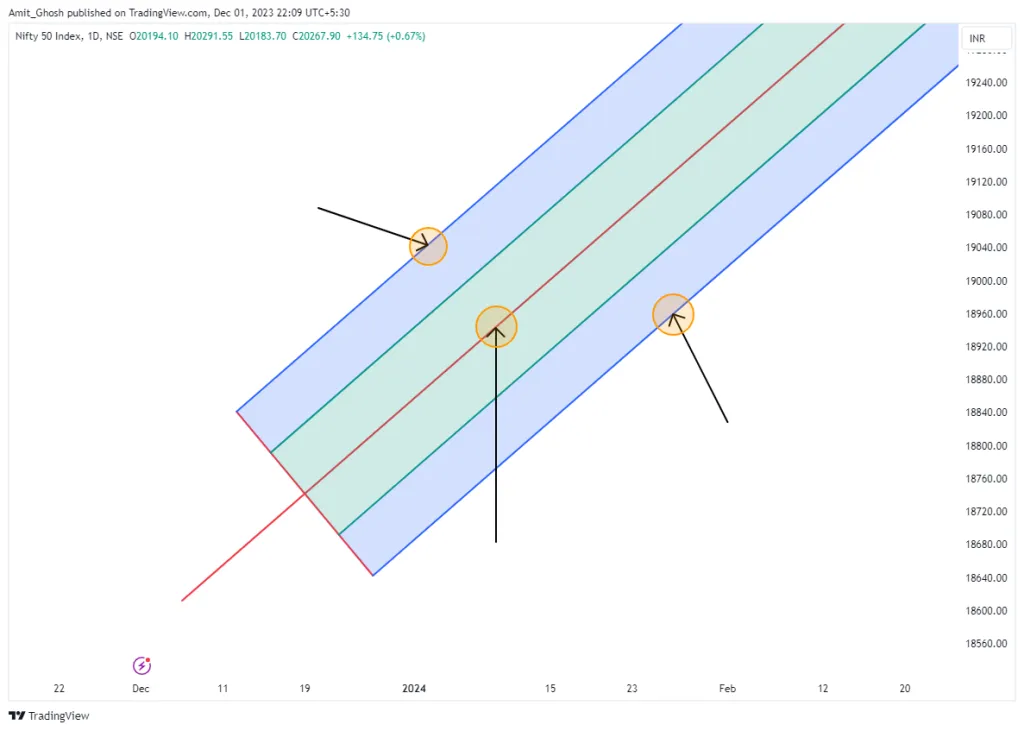
Short Trade Example (Downtrend)
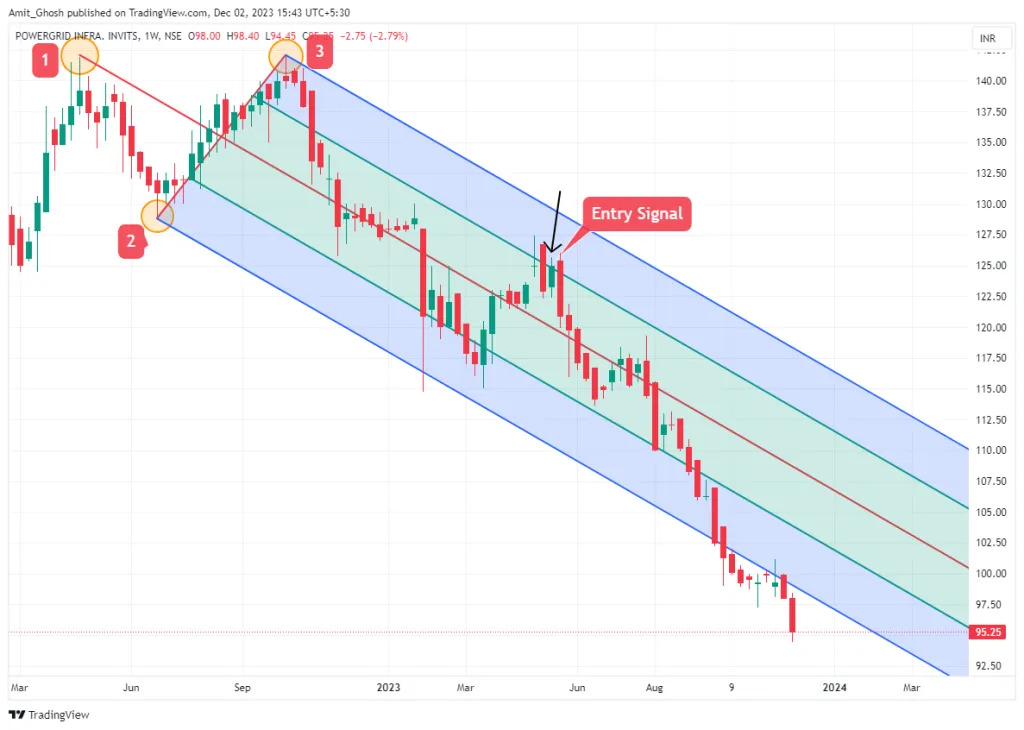
To initiate a short trade, we identify a key high (P₀), followed by a key low (P₁), and a subsequent key high (P₂).

In this example, the downtrend is so strong that the price doesn’t even pull back to the Upper Parallel Line. Instead, it respects the Median Line as resistance before continuing its fall towards the Lower Parallel Line. This indicates extreme bearish momentum.
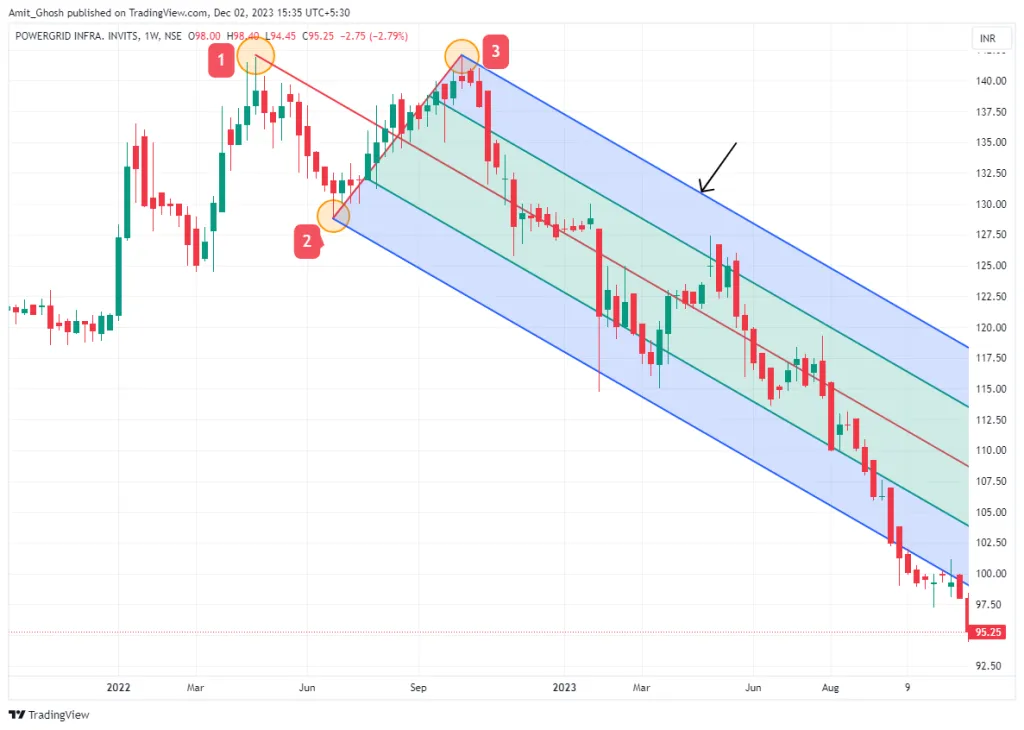
Traders can add extra parallel lines, often at Fibonacci ratios (e.g., 0.5, 1.5, 2.0) from the main channel, to identify further support/resistance levels in very strong trends. Here, a bounce from the Lower Parallel Line provided a small mean-reversion scalp opportunity back towards the Median Line.
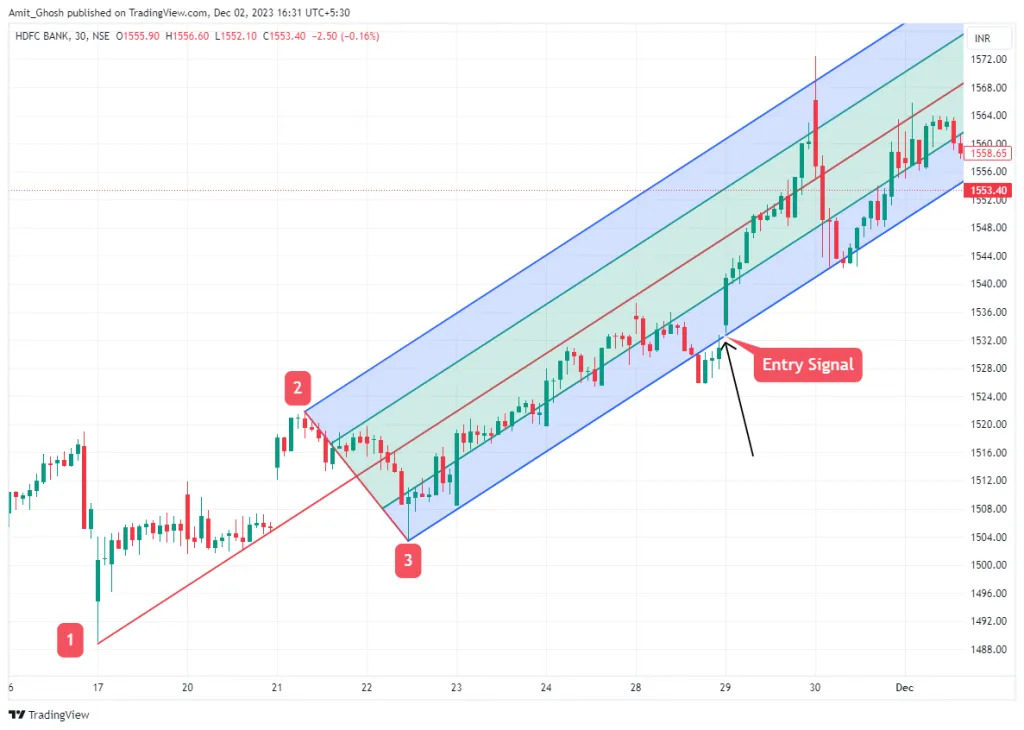
Long Trade Example (Uptrend)
For a long trade, we identify a key low (P₀), a key high (P₁), and another key low (P₂). The expectation is to buy near the Lower Parallel Line (LPL).
The entry signal appears when the price pulls back to the LPL and shows signs of reversal (e.g., a bullish candlestick pattern). The Median Line is the initial target.
Best Timeframes for Indian Markets
- Swing Trading (NIFTY, BANKNIFTY, Large-Caps): The Daily and 75-minute charts are excellent for identifying major pivots and constructing reliable channels. These timeframes filter out market noise effectively.
- Intraday Trading: The 15-minute and 5-minute charts can be used, but require more skill. The subjectivity of pivot selection becomes more pronounced on lower timeframes, leading to more false signals. It is crucial to use the Pitchfork in conjunction with other confirming indicators like Volume Profile or RSI for intraday trades.
Conclusion
The Andrews Pitchfork is a powerful tool for framing price action within a trending market. It provides a dynamic map of potential support and resistance, helping traders to anticipate market movements rather than just reacting to them.
- The Pitchfork identifies channels where price is likely to trade.
- It is plotted using three consecutive, significant pivot points (highs or lows).
- The Median Line acts as a price magnet, while the outer lines provide support and resistance.
- It is best used in trending markets and on higher timeframes (75-min, Daily) for higher reliability.
- Always use the Pitchfork as part of a broader trading plan, combining its signals with other forms of analysis for confirmation.