Average Directional Index (ADX) Indicator

The Average Directional Index, or ADX, is a technical indicator developed by J. Welles Wilder Jr. to quantify the strength of a market trend. Unlike many indicators that try to predict direction, the ADX is non-directional; it only measures the degree of trend, whether the price is moving up or down. A rising ADX indicates a strengthening trend, while a falling ADX suggests a weakening trend or a non-trending, range-bound market.
In this lesson, you will learn:
- The core components of the ADX system: the ADX line, +DI, and -DI.
- The mathematical formulas used to calculate the ADX.
- How to interpret ADX values to gauge trend strength.
- How to use the +DI and -DI lines to determine trend direction.
- Practical trading applications in the Indian markets.
- The pros and cons of adjusting the ADX period settings.
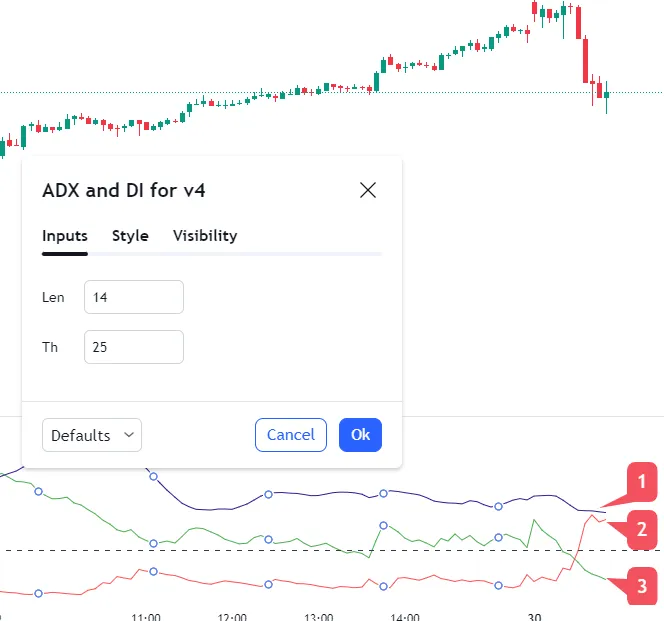
The Three Components of the ADX System
The ADX indicator is actually a system of three separate lines, which together provide a complete picture of the market’s trend:
- The ADX Line: This is the main line, typically plotted in a bold colour. It measures the strength of the trend on a scale from 0 to 100. It does not indicate the direction of the trend.
- The Positive Directional Indicator (+DI): This line measures the strength of the upward price movement.
- The Negative Directional Indicator (-DI): This line measures the strength of the downward price movement.
By analysing the ADX line in conjunction with the crossover and spread of the +DI and -DI lines, a trader can assess both the strength and the direction of a trend.
The Mathematics Behind ADX
Understanding the calculation of the ADX reveals why it is such a robust measure of trend strength. The calculation involves several steps, using a smoothing technique developed by Wilder himself. The standard period setting is 14 periods.
Step 1: Calculate Directional Movement (+DM and -DM)
First, we compare the current period’s high and low with the previous period’s high and low.
The Positive Directional Movement (+DM) and Negative Directional Movement (-DM) for the period are determined as follows:
- If UpMove > DownMove and UpMove > 0, then , otherwise .
- If DownMove > UpMove and DownMove > 0, then , otherwise .
If both +DM and -DM are negative, or if they are equal, they are both set to zero. A single period cannot have both a positive and negative directional movement.
Step 2: Calculate the True Range (TR)
The True Range is the greatest of the following three values:
- Current High minus Current Low
- Absolute value of (Current High minus Previous Close)
- Absolute value of (Current Low minus Previous Close)
Step 3: Smooth the +DM, -DM, and TR
Wilder used a specific smoothing technique, which is a variation of an exponential moving average. For a 14-period setting:
For the very first calculation, one simply sums the first 14 periods of +DM, -DM, and TR.
Step 4: Calculate the Directional Indicators (+DI and -DI)
The smoothed values are then used to calculate the +DI and -DI lines:
Step 5: Calculate the Directional Index (DX) and ADX
The Directional Index (DX) is calculated from the +DI and -DI values.
Finally, the ADX is the smoothed moving average of the DX. It is smoothed using the same 14-period method as before.
How to Read the ADX Indicator
Interpreting the ADX involves looking at two things: the value of the ADX line itself and the relationship between the +DI and -DI lines.
Gauging Trend Strength with the ADX Line
The ADX line is plotted on a scale from 0 to 100. The following table provides a general guide for interpreting its value:
| ADX Value | Trend Strength |
|---|---|
| 0-25 | Weak or Non-Existent Trend (Ranging Market) |
| 25-50 | Strong Trend |
| 50-75 | Very Strong Trend |
| 75-100 | Extremely Strong Trend (Often Unsustainable) |
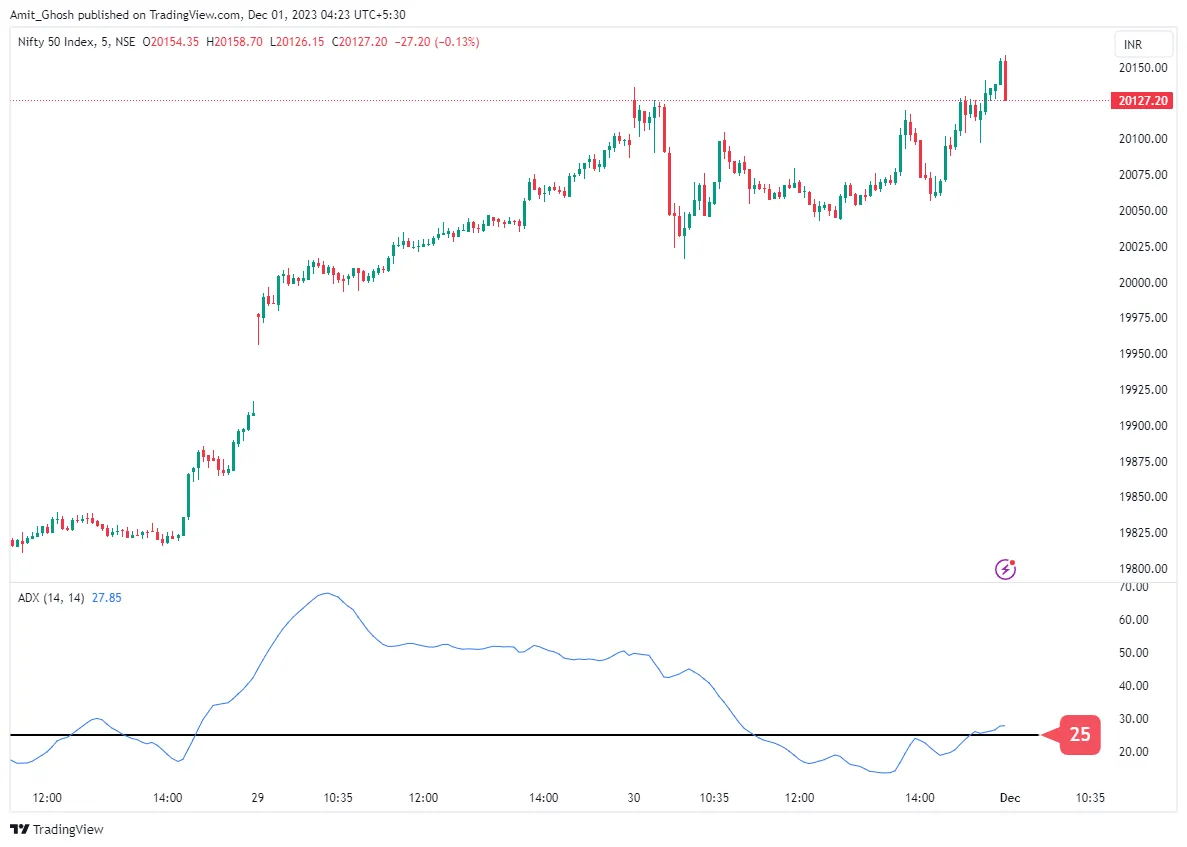
When the ADX is below 25, the market is typically in a consolidation phase or a range. Trend-following strategies are unlikely to work well in this environment. When the ADX rises above 25, it signals the start of a potentially tradable trend.
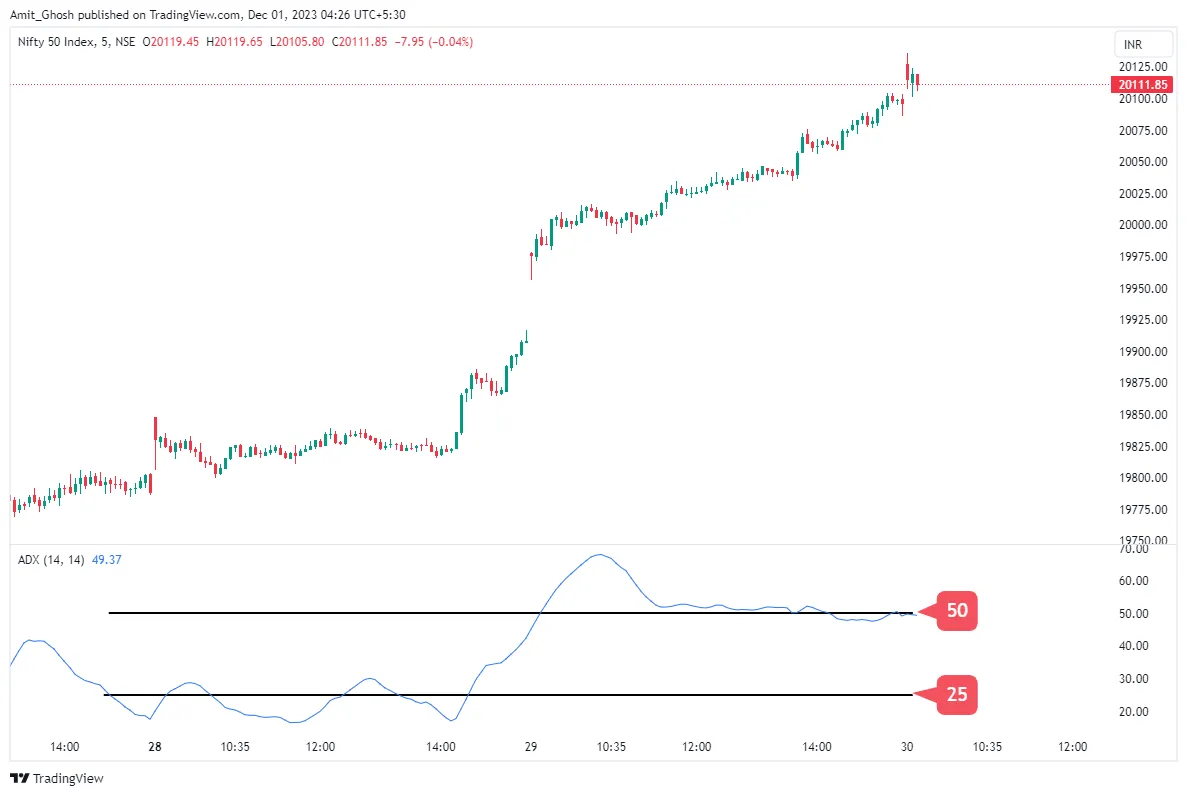
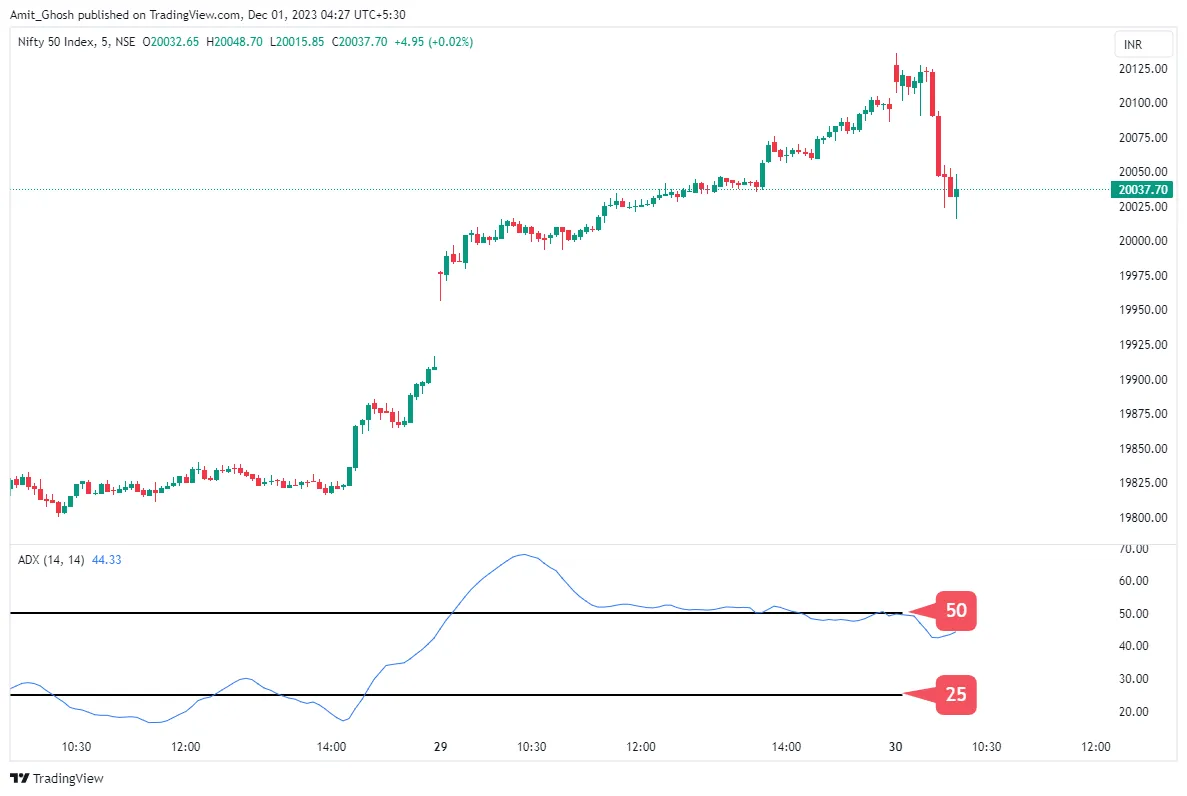
An ADX reading above 50 indicates a very powerful trend. However, extreme readings above 50 or 60 can also signal that the trend is overextended and may be due for a correction or consolidation.
As seen in the aftermath below, the market reversed after the ADX reached such an extreme level.
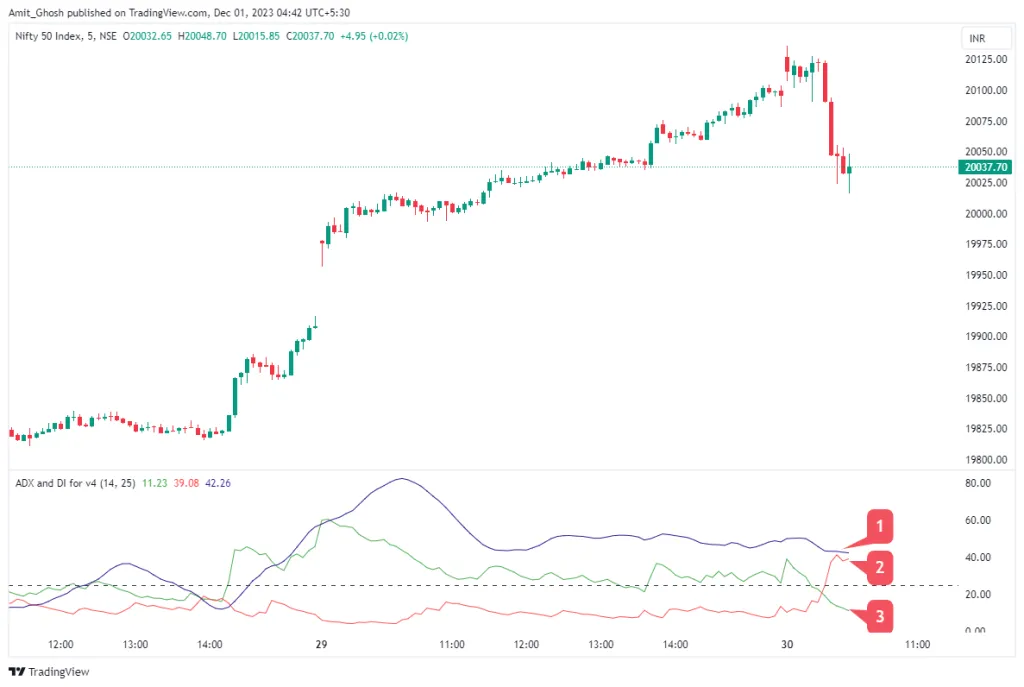
Determining Trend Direction with +DI and -DI
While the ADX line tells you about trend *strength*, the +DI and -DI lines tell you about trend *direction*.
- When +DI is above -DI, it indicates that the upward pressure on price is greater than the downward pressure. This suggests an uptrend.
- When -DI is above +DI, it indicates that the downward pressure on price is greater than the upward pressure. This suggests a downtrend.
A trading signal is often generated when these two lines cross. A crossover of +DI above -DI suggests a new uptrend may be starting, while a crossover of -DI above +DI suggests a new downtrend.
A complete trend confirmation occurs when two conditions align:
- The directional lines cross (e.g., +DI crosses above -DI for an uptrend).
- The ADX line is above 25 (confirming the trend has sufficient strength).
Practical Trading Applications
The ADX is not a standalone trading system but a valuable tool for confirming trade setups.
- Trend Filtering: The primary use of ADX is to filter trades. For a trend-following system, a trader might only take long trades when +DI is above -DI and ADX is above 25. Similarly, short trades would only be considered when -DI is above +DI and ADX is above 25.
- Strategy Selection: The ADX can help you choose the right strategy for the current market condition. If ADX is low (<25), range-trading strategies like those based on oscillators (Stochastics, RSI) or Bollinger Bands® might be more appropriate. If ADX is high (>25), trend-following strategies are preferred.
- Identifying Trend Exhaustion: When the ADX reaches an extremely high level (e.g., above 60-70) and then turns down, it can signal that the trend has reached a climax and is losing momentum. This is not a reversal signal on its own, but a warning to tighten stops or take partial profits.
Best Timeframes for Indian Markets
For active traders in the Indian markets, the ADX can be applied across various timeframes.
- Day Trading (NIFTY, BANKNIFTY): On 5-minute and 15-minute charts, an ADX(14) can help identify the strongest, most directional moves of the day, filtering out the noise of choppy price action.
- Swing Trading (NSE Stocks): On the 1-hour, 4-hour, and Daily charts, the ADX is excellent for identifying stocks in a persistent trend, suitable for swing trading positions held over several days or weeks. For daily charts, a slightly longer ADX period like 20 can sometimes provide smoother, more reliable signals.
Adjusting the ADX Period Settings
The standard ADX setting is 14 periods, but this can be adjusted to suit your trading style.
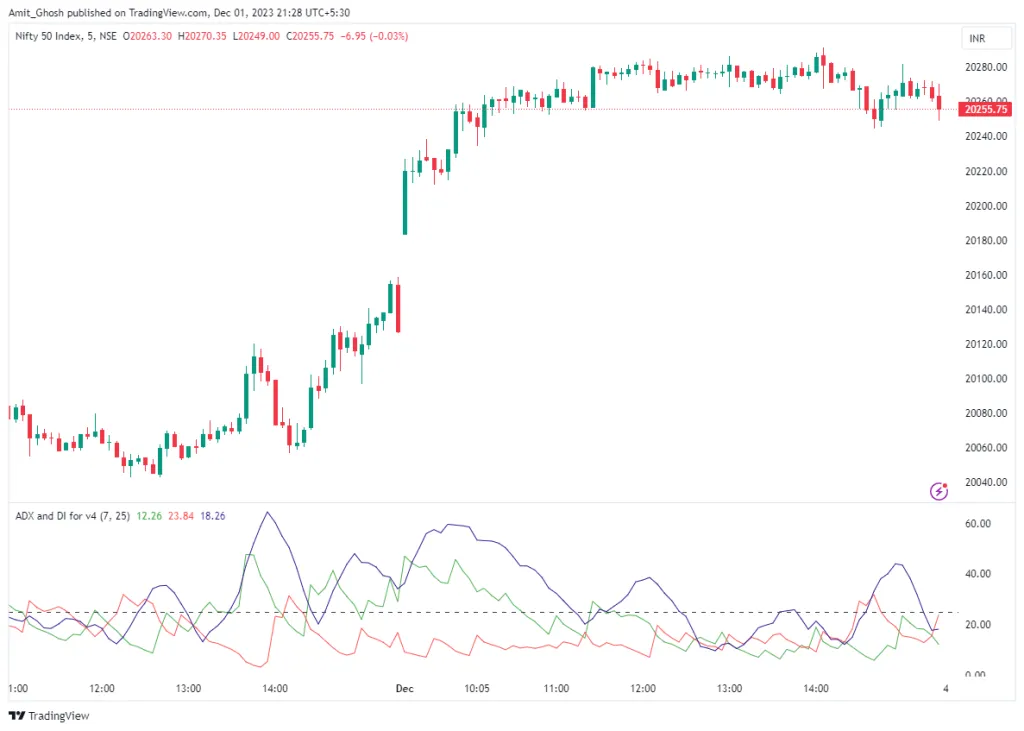
Shorter Period (e.g., 7)
A shorter setting makes the ADX more sensitive to recent price changes.
- Advantage: It will detect new trends earlier.
- Disadvantage: It will generate more frequent signals, including a higher number of false signals or “whipsaws.”
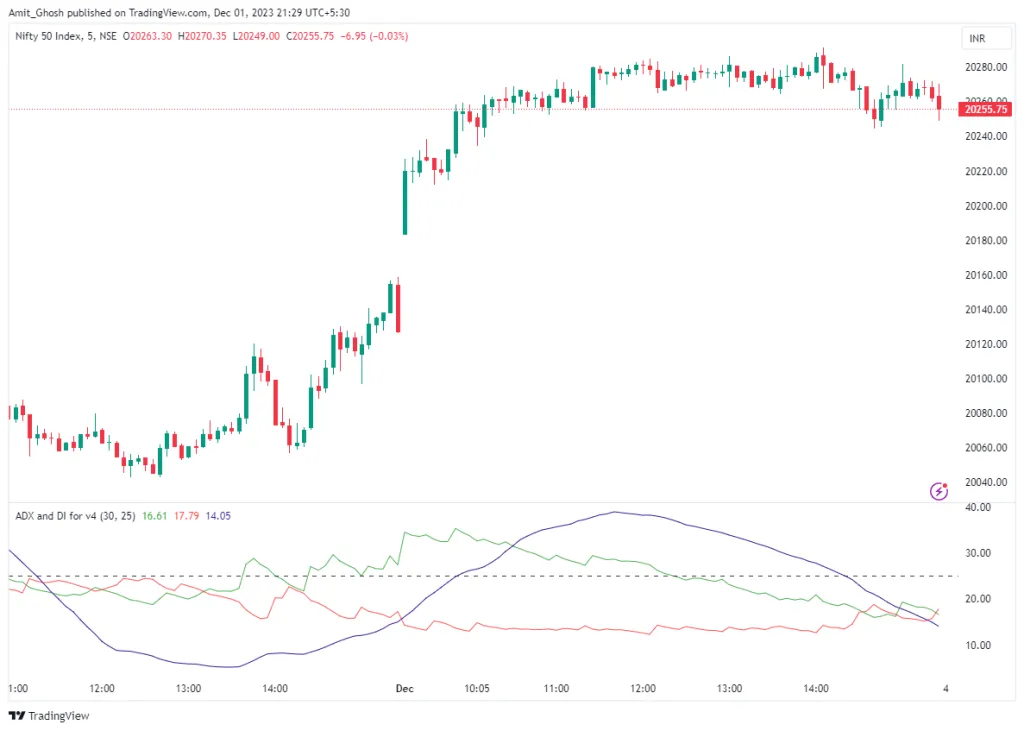
Longer Period (e.g., 30)
A longer setting makes the ADX smoother and less reactive.
- Advantage: It filters out more market noise and provides more reliable signals for long-term trends.
- Disadvantage: It will be slower to react, confirming a trend much later and potentially missing the initial part of the move.
Conclusion
The Average Directional Index is an indispensable tool for the serious trend trader. Its unique ability to quantify trend strength, rather than just direction, provides a critical filter that can significantly improve the performance of a trading strategy. By combining the ADX line’s reading with the signals from the +DI and -DI lines, traders can gain a comprehensive understanding of market dynamics, helping them to stay out of choppy, unprofitable markets and to capitalize on strong, sustained trends.