Average True Range (ATR) Indicator

The Average True Range (ATR) is a core volatility indicator developed by J. Welles Wilder Jr. for commodity trading, but its application is universal across all markets, including Indian equities and indices. Unlike directional indicators like Moving Averages or RSI, the ATR’s sole purpose is to measure the degree of price volatility or the ‘loudness’ of the market. It does not provide any information about price direction.
This lesson will cover the mathematical construction of the ATR, its practical calculation, interpretation, and its primary applications in a trading system for setting risk parameters like stop losses and position size.
What the ATR Indicator Shows
The ATR indicator is a graphical representation of how much an asset’s price has moved, on average, over a specified number of periods. In simple terms, it measures the average size of the price candles, including any overnight or weekend gaps.
- A rising ATR indicates that market volatility is increasing. The price bars are, on average, getting larger.
- A falling ATR indicates that market volatility is decreasing. The price bars are, on average, getting smaller, often seen during market consolidation.
- The ATR value is expressed in the same units as the price. For NIFTY, an ATR of 150 means an average range of 150 points. For a stock like RELIANCE, an ATR of 45 means an average range of Rs. 45.
Crucially, the ATR is non-directional. A high ATR can be seen during a powerful, trending bull run, a panic-driven crash, or a choppy, violent sideways market. It only quantifies the magnitude of price movement, not its direction or trend quality.
The Mathematical Formula for ATR
The ATR is based on the concept of the **True Range (TR)**, which is calculated for each period. The TR is the greatest of the following three values:
- The current period’s High minus the current period’s Low.
- The absolute value of the current period’s High minus the previous period’s Close.
- The absolute value of the current period’s Low minus the previous period’s Close.
In mathematical terms:
The ATR is then a smoothed moving average of the TR values, typically calculated over 14 periods. The calculation proceeds in two steps.
Step 1: Initial ATR Value
The first ATR value is a simple arithmetic mean of the first 14 TR values.
Step 2: Subsequent ATR Values (Wilder’s Smoothing)
After the initial value, all subsequent ATR values are calculated using Wilder’s exponential smoothing method. This method gives more weight to recent values.
This ensures the ATR value is a continuously updated, smoothed measure of volatility.
How to Calculate ATR: An Example
Let’s calculate the TR and a 3-period ATR for a hypothetical stock to understand the mechanics.
| Day | High | Low | Close | TR Calculation | True Range (TR) |
|---|---|---|---|---|---|
| 1 | 105 | 101 | 104 | H-L = 4 | 4 |
| 2 | 108 | 103 | 107 | max[(108-103), abs(108-104), abs(103-104)] = max[5, 4, 1] | 5 |
| 3 | 106 | 100 | 101 | max[(106-100), abs(106-107), abs(100-107)] = max[6, 1, 7] | 7 |
| 4 | 112 | 105 | 111 | max[(112-105), abs(112-101), abs(105-101)] = max[7, 11, 4] | 11 |
- Calculate TR for each day: The table above shows the calculation. Notice on Day 3 and Day 4, the gap between the previous close and the current high/low was the largest component, capturing the full volatility.
- Calculate the initial 3-period ATR: (4 + 5 + 7) / 3 = 5.33. This is the ATR value at the end of Day 3.
- Calculate the next ATR value for Day 4: Using the smoothing formula, the ATR at the end of Day 4 is: ((5.33 * 2) + 11) / 3 = 7.22.
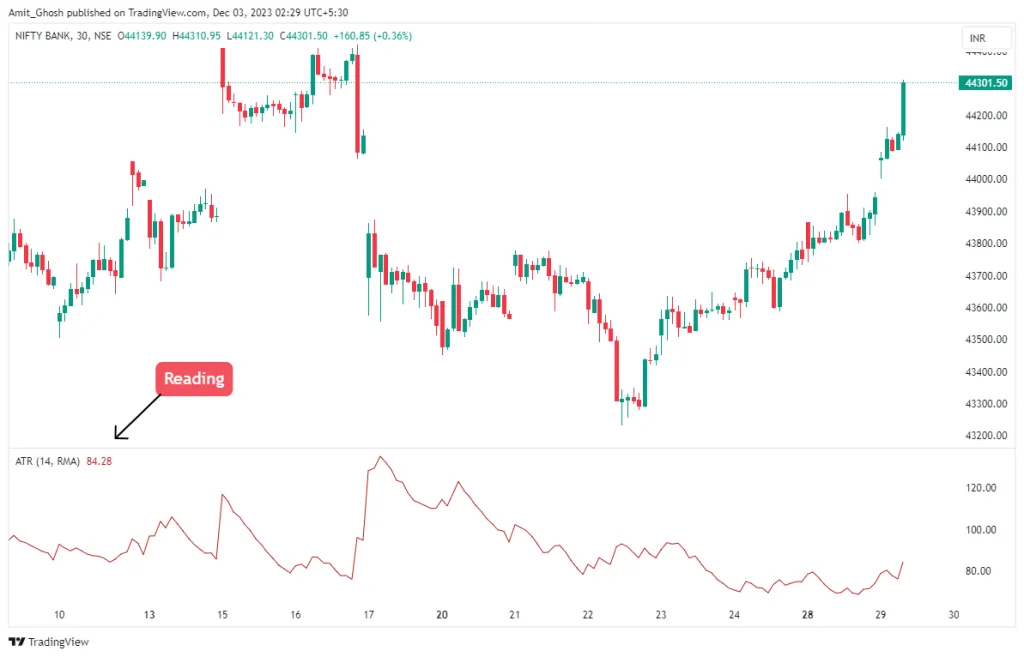
How to Read the ATR Indicator
The ATR is plotted as a single line in a panel below the main price chart.
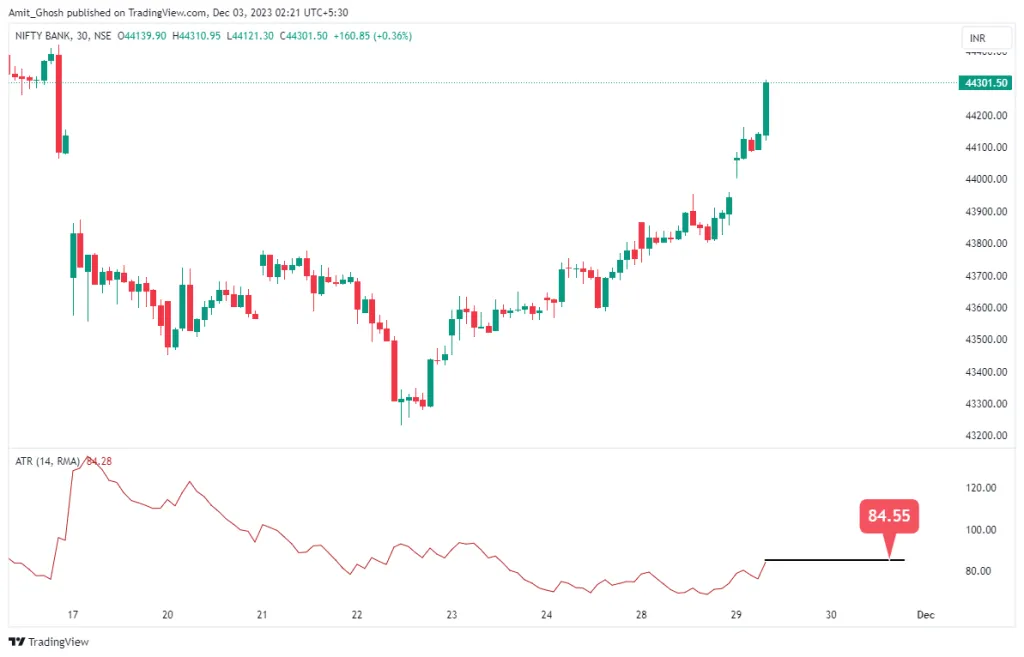
As per the chart above, the ATR for Bank Nifty on the 30-minute timeframe is 84.55. This means that over the last 14 periods (14 x 30 minutes), the index has moved an average of 84.55 points per half-hour candle. This number provides a baseline expectation for volatility. If market conditions remain similar, one might anticipate price swings of this magnitude. It is not a prediction, but a statistical measure of recent behaviour.
How to Use the ATR Indicator for Trading
The most robust use of ATR is for risk management, not for generating entry signals.
Stop Loss Placement
This is the primary and most effective use of the ATR. A common mistake is using tight, fixed-point or percentage-based stop losses. These do not adapt to changing market volatility. A stop loss that is appropriate in a quiet market will be too tight in a volatile one, leading to premature stop-outs from random market noise.
ATR-based stops solve this. A multiple of the ATR is used to set the stop loss distance from the entry price. A common multiple is 2x ATR.
- For a long trade, Stop Loss = Entry Price – (2 * ATR)
- For a short trade, Stop Loss = Entry Price + (2 * ATR)
For example, if you go long on BANKNIFTY at 45,000 and the current 14-period ATR is 85, a 2x ATR stop loss would be placed at 45,000 – (2 * 85) = 44,830. This gives the trade room to breathe and absorb the normal volatility of 170 points without getting stopped out by noise.
Profit Target Placement
While less common, ATR can also be used to set realistic profit targets based on risk-reward ratios. If your stop loss is set at 2x ATR, you might set a profit target for a 1:1.5 risk-reward ratio at 3x ATR from your entry.
- For a long trade, Profit Target = Entry Price + (3 * ATR)
This keeps profit expectations grounded in the market’s recent volatility.
Position Sizing
ATR is critical for volatility-adjusted position sizing. The goal is to risk the same rupee amount on every trade.
In a high volatility environment (high ATR), your stop loss will be wider in points. To maintain constant rupee risk, your position size must be smaller. Conversely, in a low volatility market (low ATR), your stop loss will be tighter, allowing for a larger position size.
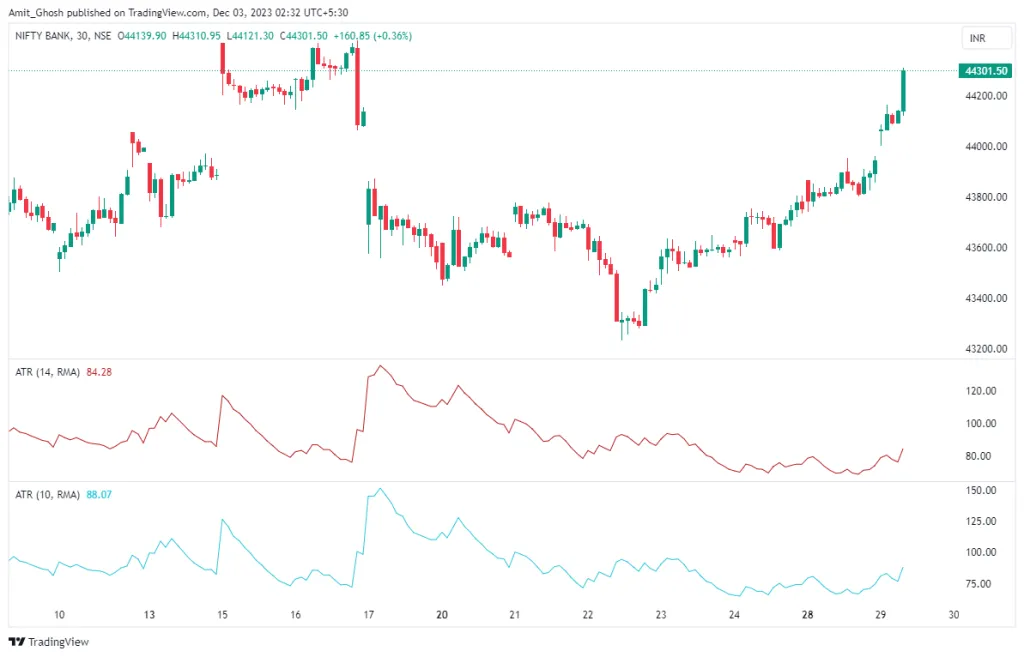
Changing the ATR Period Settings
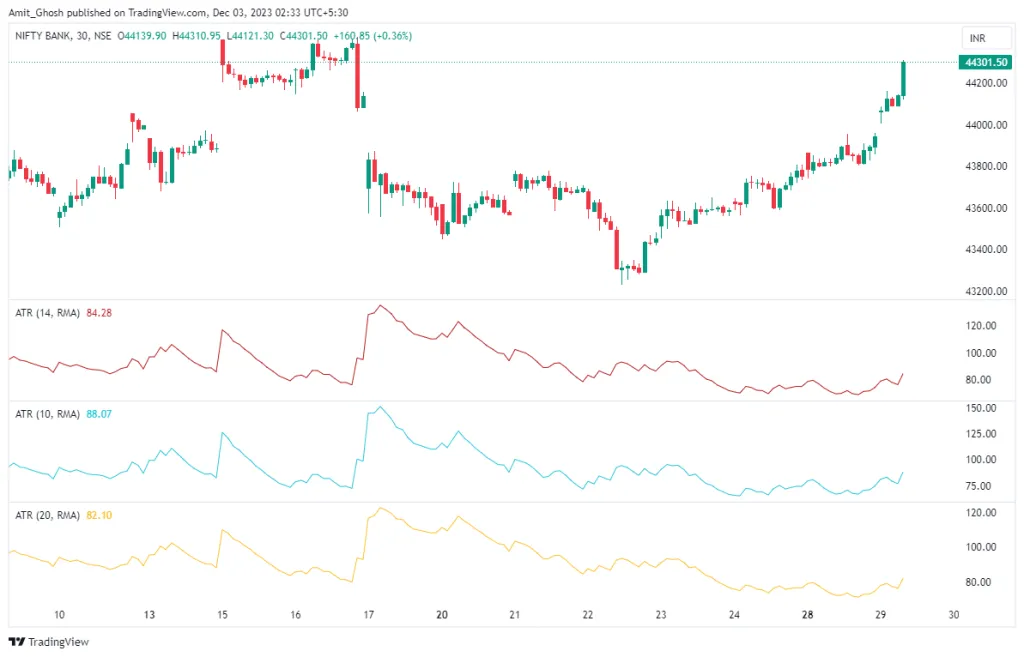
The standard setting for ATR is 14 periods. Adjusting this will change its sensitivity.
- Shorter Period (e.g., 7): A shorter period makes the ATR more sensitive and reactive to recent price changes. The ATR line will appear “choppy” and will spike more frequently.
- Longer Period (e.g., 21): A longer period makes the ATR less sensitive and smoother. It reflects a longer-term average of volatility.
There is no “best” setting; it must be aligned with your trading system’s logic and holding period. A short-term scalper might prefer a more responsive ATR, while a swing trader might prefer a smoother, longer-term ATR. Any changes should be rigorously backtested.
Best Timeframes for Indian Markets
The utility of ATR is consistent across timeframes, but its value will differ significantly.
- Intraday Trading (NIFTY, BANKNIFTY): For intraday strategies, the 5-minute and 15-minute charts are most common. The 14-period ATR on these charts gives a good measure of current session volatility for setting stops.
- Swing Trading (NSE Stocks): For holding positions over several days or weeks, the daily chart is the standard. The 14-day ATR is a robust measure of a stock’s typical daily price movement and is ideal for setting swing trading stop losses.