Understanding the MACD Indicator: A Comprehensive Guide

In this section You will learn –
- What the MACD Indicator is
- How to read the Indicator
- The three components that make up the MACD
- How to trade using the MACD
- How to change the MACD settings and what the implications are
What the MACD Indicator is -
The Moving Average Convergence Divergence Indicator or MACD as it is known is mostly used as a trending indicator.
It helps traders determine –
- The market direction,
- The strength of the move, and
- When that direction may change.
Although it lags behind price, it gives the trader the possibility of entering a trend early on and can at times help a trader exit the market before the trend reverses.
How to read the MACD indicator
The three components that make up the MACD. The MACD indicator comprises three separate readings, which appear together in a box underneath the price chart: a MACD line, a signal line and a histogram that shows the difference between the two lines.
The image below shows how the indicator appears on a chart:
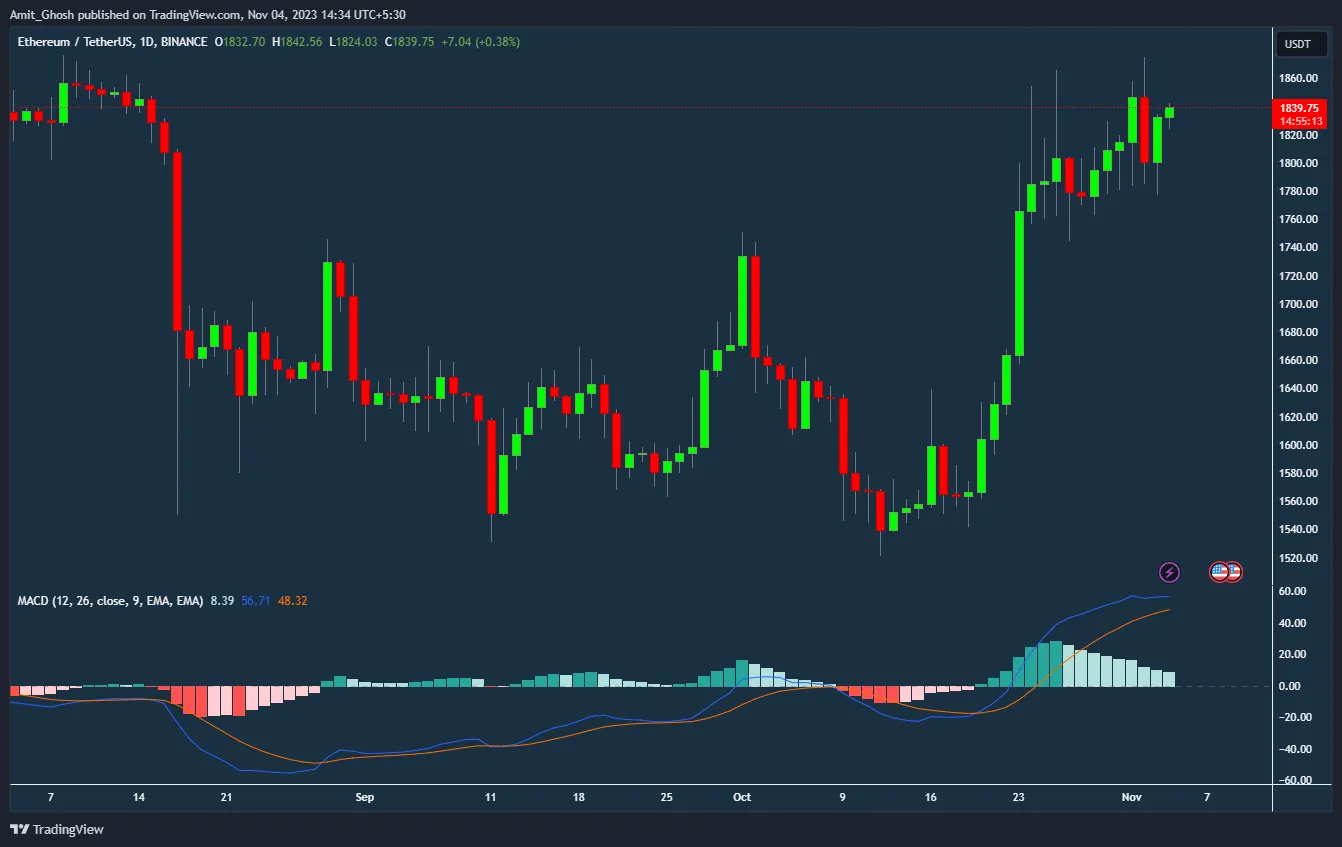
The MACD indicator is made up of three separate elements, these appear together and are normally found underneath the price chart on most trading software.
The three components that make up the MACD
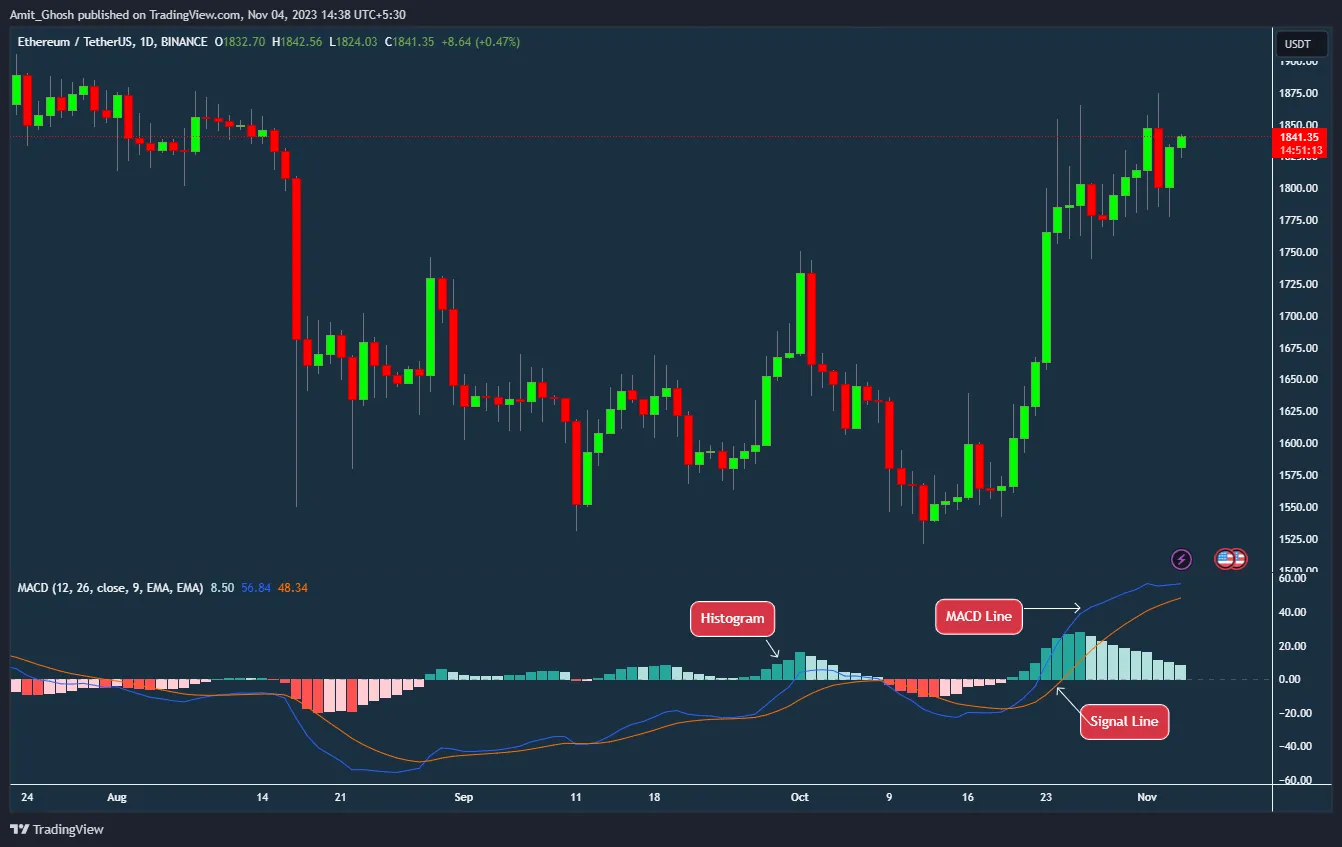
They are –
- Signal line (Brown Line)
- MACD (Blue Line)
- Histogram
Let us now look at each of these three signals in a bit more detail.
The moving average line (Blue Line)
- We will start with the MACD line, which is a moving average type line that tracks the actual price of an asset.
- The blue MACD line is a moving average type line that tracks the underlying asset’s price.
The signal line (Brown Line)
- The brown signal line is a moving average of the MACD line itself.
- This line is designed to smooth the movement of the MACD line.
- It also helps with producing trading signals.
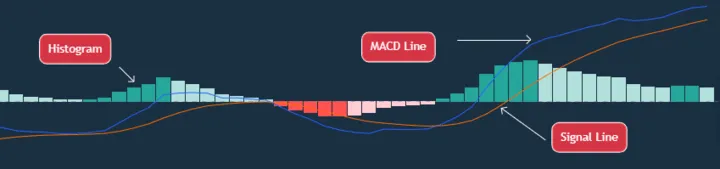
The histogram
- The final part of the MACD indicator is the histogram.
- This displays the difference between the MACD line and the signal line and appears as bars either below or above the zero line.
In the context of the MACD (Moving Average Convergence Divergence) indicator, a histogram is a visual representation that shows the difference between the MACD line and its signal line. It is typically displayed as a series of bars on a chart.
Here’s how it works:
- When the MACD line is above the signal line, the histogram is positive and will appear above the zero line on the chart, indicating upward momentum.
- Conversely, when the MACD line is below the signal line, the histogram is negative and will appear below the zero line, indicating downward momentum.
- The height of the bars in the histogram represents the strength of the price movement or momentum.
- Tall bars indicate strong momentum, while short bars suggest weak momentum. This helps traders recognize when a trend might be gaining or losing strength, potentially signaling when it might be a good time to enter or exit a trade.
Useless thing to know ->
The term “histogram” comes from a combination of two Greek words: “histos” meaning “anything set upright” (as the masts of a ship, the bar of a loom, or even a web of cloth), and “gram” meaning “drawing, record, or writing”. Essentially, the term translates to a “drawing of uprights”. In a histogram, each bar represents the frequency of occurrence by the area of the bar, with the height of the bar standing upright to show the size of the frequency or count, hence the appropriateness of the name.
So,
Signal Line is Moving Average of Moving Average of the UnderLying!
- The signal line on the MACD indicator is essentially a moving average of the MACD line itself, which is already a moving average type line that tracks the price of the underlying asset.
- This additional smoothing process helps to provide clearer signals by filtering out some of the noise and short-term volatility in the MACD line.
- It’s this relationship between the two that generates the trading signals used in analysis.