RSI Indicator

The Relative Strength Index (RSI) is a versatile and widely-used momentum oscillator developed by J. Welles Wilder Jr. and introduced in his 1978 book, “New Concepts in Technical Trading Systems.” It measures the speed and change of price movements, helping traders identify overbought or oversold conditions in a market. The RSI oscillates between 0 and 100, providing a clear visual representation of a security’s recent buying and selling pressure.
The Mathematical Foundation of RSI
The RSI’s calculation is based on the ratio of average gains to average losses over a specified lookback period, typically 14 periods. Understanding its formula is key to grasping its behaviour.
The calculation involves three main steps:
1. Relative Strength (RS)
First, we calculate the Relative Strength (RS), which is the ratio of the average of upward price changes (‘Average Gain’) to the average of downward price changes (‘Average Loss’) over the lookback period.
The Average Gain is the sum of all positive price changes in the period divided by the period length (e.g., 14). Similarly, the Average Loss is the sum of the absolute values of all negative price changes divided by the period length.
2. The RSI Formula
Next, the RS value is converted into an oscillator that ranges from 0 to 100 using the following formula:
This normalization ensures the indicator is easy to interpret. A high RS value (many large up-moves compared to down-moves) will result in an RSI close to 100. A low RS value will result in an RSI close to 0.
3. Wilder’s Smoothing Method
For all subsequent calculations after the initial 14 periods, Wilder used a specific smoothing method to calculate the new Average Gain and Average Loss. This gives more weight to recent data without discarding older information entirely.
This exponential smoothing makes the RSI line smoother and less prone to erratic movements compared to a simple moving average.
How to Calculate the RSI Step-by-Step
Let’s walk through a simplified 5-period RSI calculation.
Assume the following 6 closing prices for a stock:
100, 102, 101, 104, 105, 103
- Calculate Price Changes: Find the change in price from one period to the next.
- Period 2: 102 – 100 = +2 (Gain)
- Period 3: 101 – 102 = -1 (Loss)
- Period 4: 104 – 101 = +3 (Gain)
- Period 5: 105 – 104 = +1 (Gain)
- Period 6: 103 – 105 = -2 (Loss)
- Calculate Initial Average Gain & Loss: For our 5-period example, we sum the gains and losses over the first 5 changes.
- Total Gains: 2 + 3 + 1 = 6
- Total Losses: 1 + 2 = 3
- Average Gain: 6 / 5 = 1.2
- Average Loss: 3 / 5 = 0.6
- Calculate the First RS and RSI:
- RS = 1.2 / 0.6 = 2
- RSI = 100 – (100 / (1 + 2)) = 100 – 33.33 = 66.67
This process is repeated for each new period, using the smoothing formula to update the average gain and loss, which in turn updates the RSI value.
How to Read the RSI Indicator
The RSI is plotted as a single line on a sub-chart below the main price chart. Traders focus on three key levels.
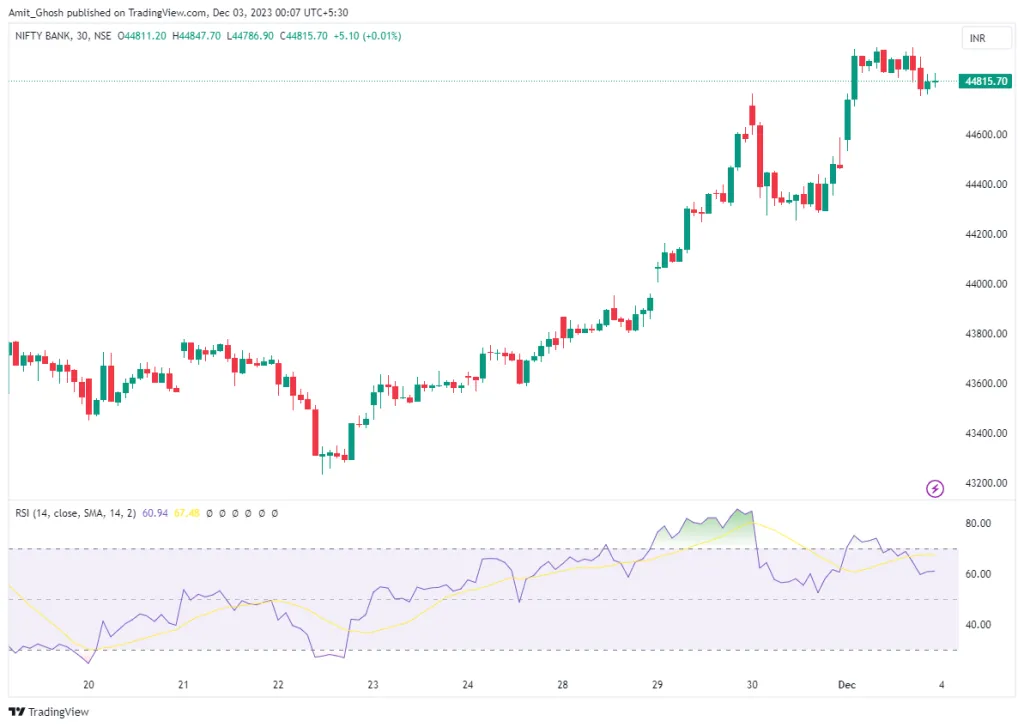
- The Overbought Level (70): When the RSI moves above 70, it suggests that the security is becoming overbought and may be due for a corrective pullback. It indicates a period of strong buying pressure that might be unsustainable.
- The Oversold Level (30): When the RSI moves below 30, it suggests that the security is becoming oversold and could be poised for a rebound. It highlights a period of intense selling pressure that might be exhausting itself.
- The Mid-Level (50): The 50-level is the centerline. When RSI is above 50, it suggests that average gains are larger than average losses, indicating bullish momentum. When below 50, it suggests bearish momentum. A cross of the 50-level can signal a potential shift in the trend’s direction.
Trading Uses of the RSI
The RSI is not just for identifying overbought and oversold levels. It’s a multifaceted tool with several applications.
1. Finding Potential Entry Points
The most common use of RSI is to time entries. A trader might look for a shorting opportunity when the RSI crosses above 70 and then hooks back down, or a buying opportunity when it dips below 30 and then crosses back up.
Bearish Signal Example
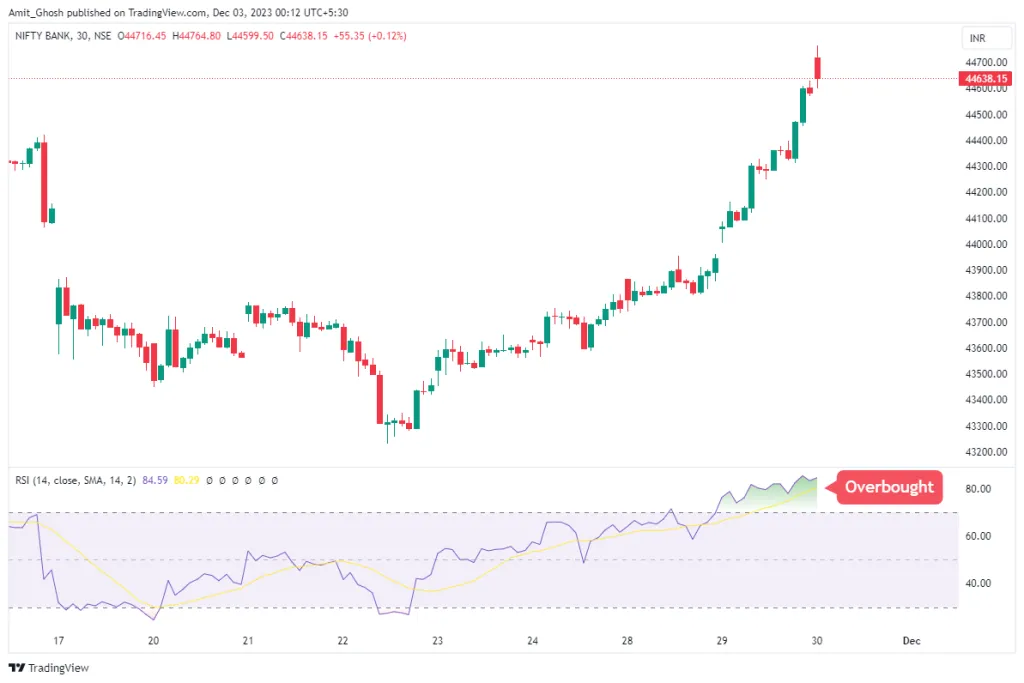
In this example, as the RSI moves above the 70 level, the preceding uptrend loses momentum and the price begins to consolidate before turning down.
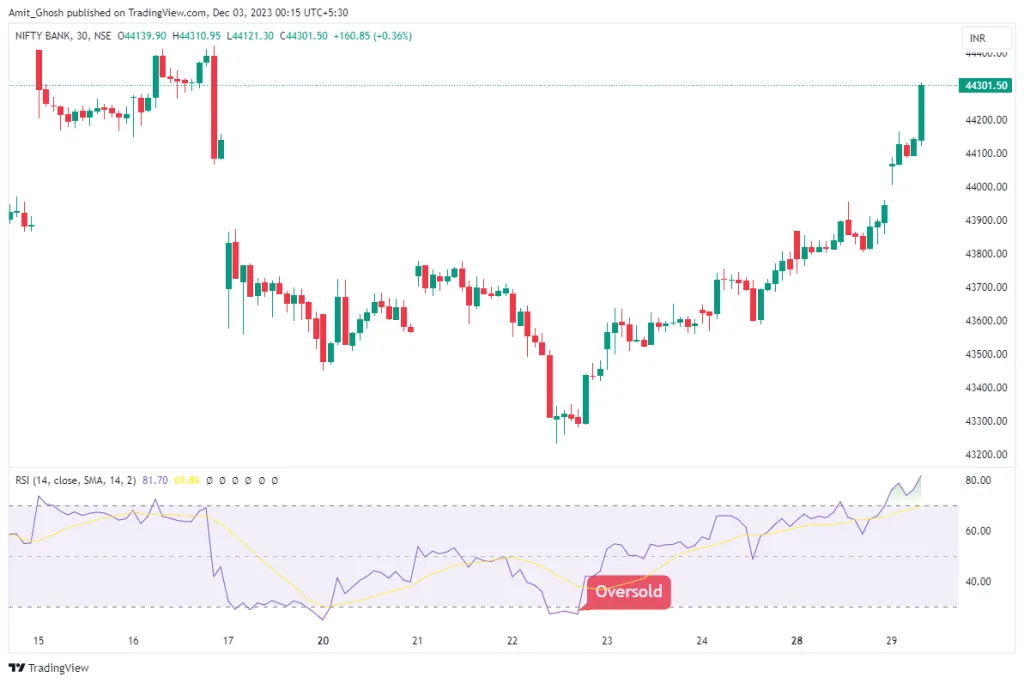
Bullish Signal Example
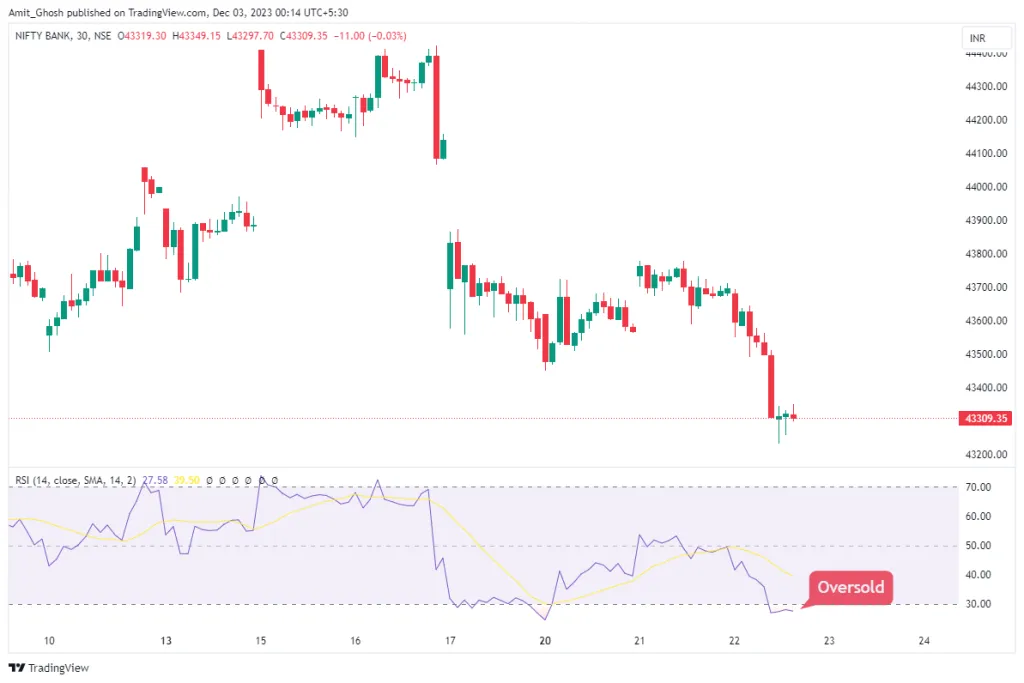
Here, the RSI dips below the 30 level, signalling an oversold market. The downtrend subsequently pauses and, following some buying interest (indicated by the pin bars), the price begins to reverse upwards.
2. Divergence Analysis
One of the most powerful applications of the RSI is identifying divergences. A divergence occurs when the price action disagrees with the RSI’s movement, often signalling a potential trend reversal.
- Bearish Divergence: Price makes a new higher high, but the RSI makes a lower high. This suggests that the momentum behind the uptrend is fading, and a reversal to the downside may be imminent.
- Bullish Divergence: Price makes a new lower low, but the RSI makes a higher low. This indicates that selling pressure is weakening, and a reversal to the upside could be on the horizon.
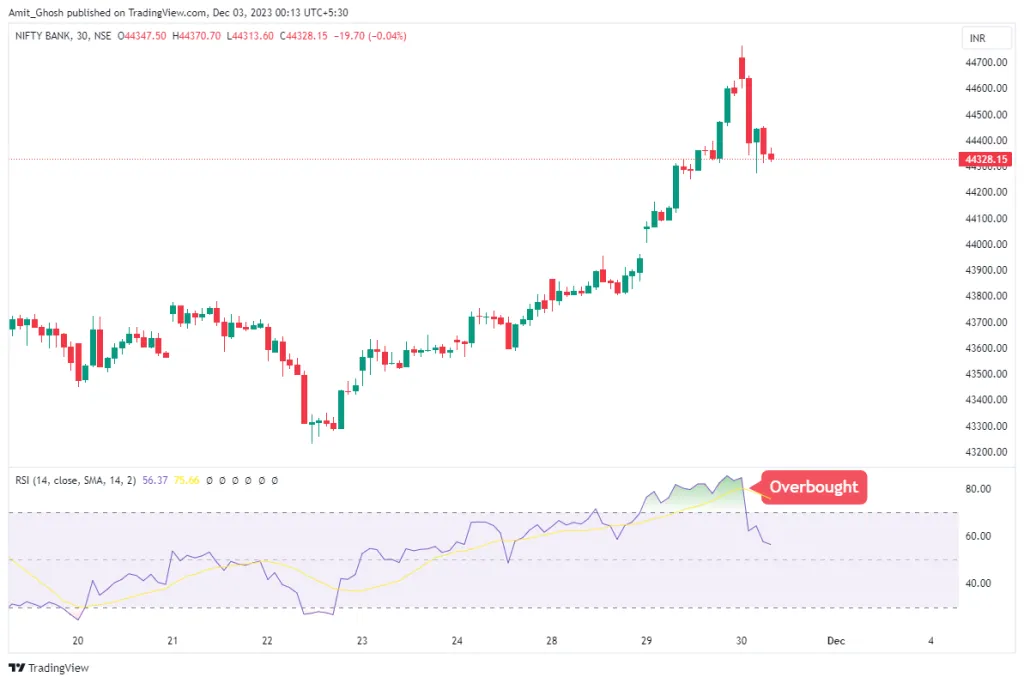
3. Using RSI For Exiting a Trade
The RSI is also effective for managing exits. If you are in a long position and the RSI moves into the overbought territory (above 70), it can serve as a signal to take partial or full profits, as the upward momentum may be waning. The same logic applies to a short position when the RSI enters the oversold zone.
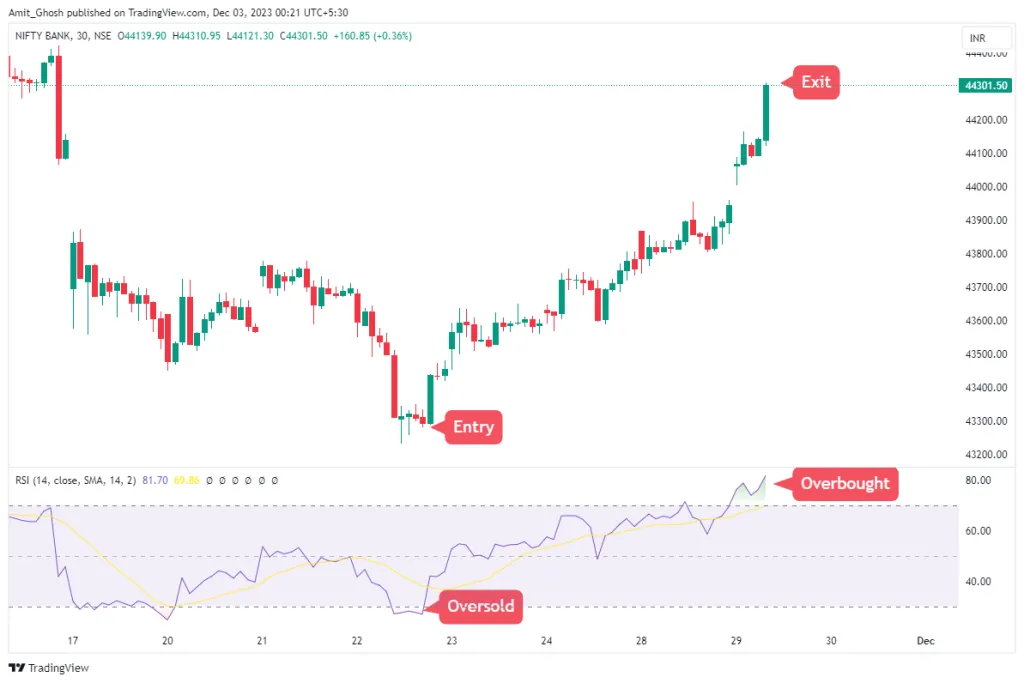
In this chart, a trader in a long position would note the RSI moving above 70 as a sign of potential trend exhaustion, prompting a decision to exit or reduce the position size.
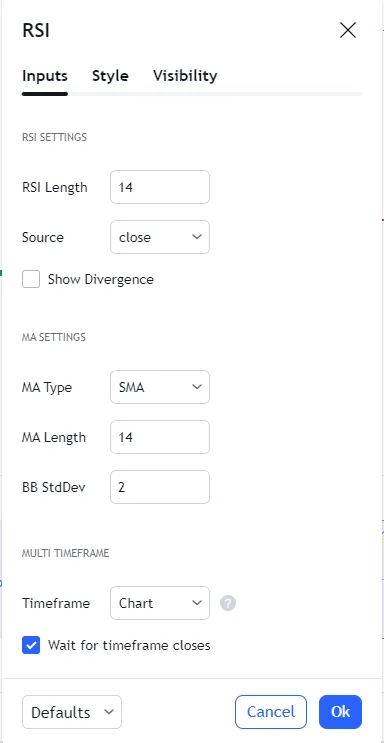
Changing the RSI Settings
While the 14-period RSI is the standard, traders can adjust the lookback period to suit their strategy.
- Shorter Period (e.g., 7 or 9): A shorter period makes the RSI more sensitive to price changes. It will reach overbought/oversold levels more frequently, providing more signals. This may be suitable for short-term scalping but will also generate more false signals.
- Longer Period (e.g., 21 or 28): A longer period makes the RSI less sensitive and smoother. It will reach extreme levels less often, providing fewer but potentially more reliable signals. This is often preferred by long-term trend followers.
Example: 28-Period RSI (Less Sensitive)
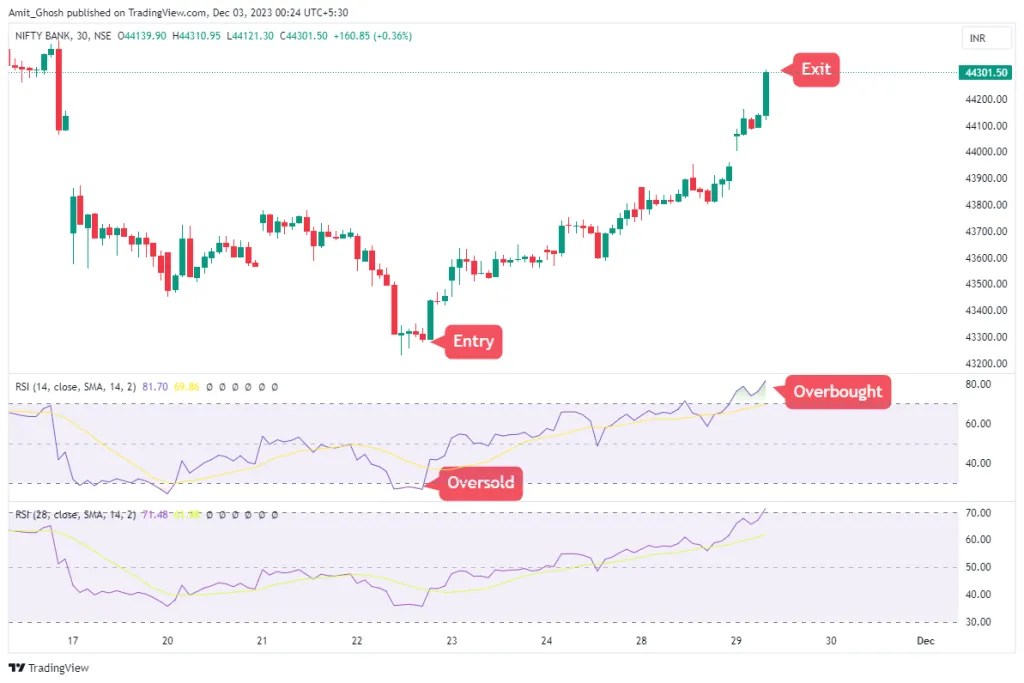
With the setting changed to 28, notice how the indicator is much smoother. It did not dip below 30 to give the original buy signal, filtering out what it considers short-term noise.
Example: 7-Period RSI (More Sensitive)
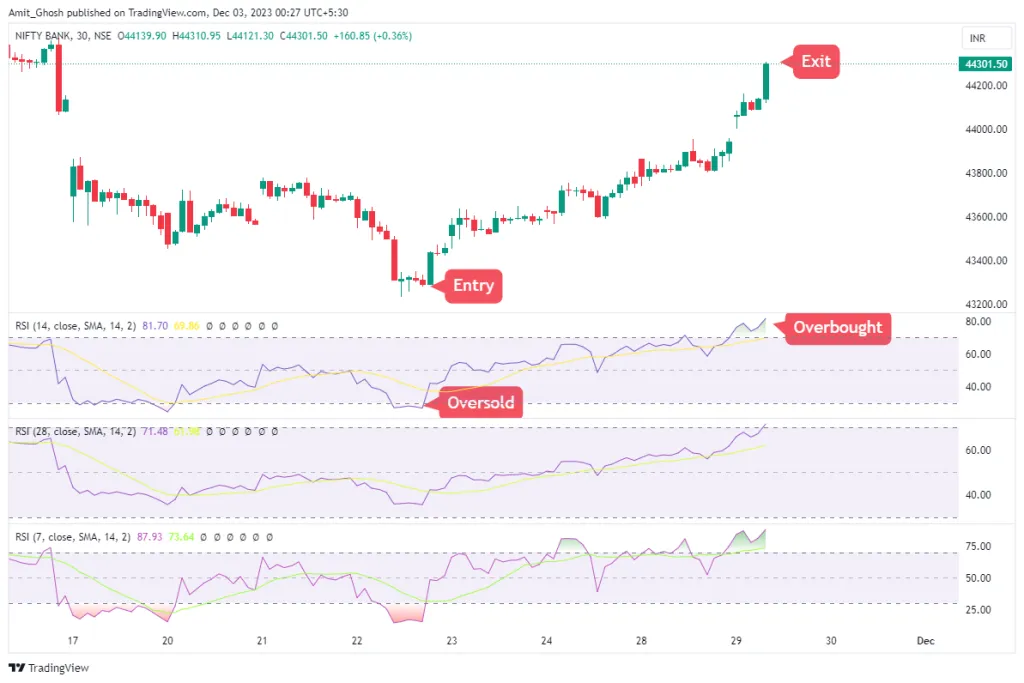
With a 7-period setting, the RSI is much more volatile. It became “overbought” three times during the same uptrend, which could have led to a premature exit from a profitable trade if used in isolation.
Best Timeframes for Indian Markets
For swing and positional trading of liquid NSE stocks and indices like NIFTY and BANKNIFTY, the Daily and 75-minute timeframes with a standard 14-period RSI tend to provide clean and reliable signals. For intraday trading, while 5-minute and 15-minute charts are popular, the noise-to-signal ratio increases significantly. Intraday traders must be more adept at confirming RSI signals with other tools like volume profiles, support/resistance levels, and candlestick patterns to improve their probability of success.
Conclusion
To summarize the key points on the RSI indicator:
- The RSI is a momentum oscillator that measures the speed and change of price movements, contained within a 0-100 range.
- Readings above 70 typically indicate overbought conditions, while readings below 30 indicate oversold conditions.
- It can be used for timing entries, planning exits, and confirming trend strength.
- Divergence between price and the RSI is a powerful signal for potential trend reversals.
- The standard 14-period setting is robust, but can be adjusted for higher sensitivity (shorter period) or lower sensitivity (longer period) depending on your trading style.