Long Time Butterfly

A Long Time Butterfly or Time Fly is a variation of Calendar Spread, which is also referred to as Time Spread, is a trading strategy for derivatives is a direction neutral and low-risk strategy that profits from theta (i.e. profit increases with time).
Although it is said to be having maximum profit if there is no directional movement, it also profits from extreme movements. So, the effect of vega is very complex as it has a dynamic payoff.
Direction Assumption: Neutral and Extreme Moves
Setup: Like Butterfly Spread, this is also typically created using a ratio of 1-2-1.
- Sell Call/Put options of ATM strike price of the nearest expiry.
- Buy 2 Call/Put options of ATM strike price of slightly far expiry.
- Sell Call/Put options of ATM strike price of ever far expiry.
All options must be the same type (either all calls or puts), with approximately the same amount of time between expirations. Like, in weekly options, if we do first week, second week and take the last week (i.e. monthly expiry) instead of the third week (assuming third week is not the last week), it will create asymmetry. It is fine but is not recommended!
Ideal Implied Volatility Environment: High
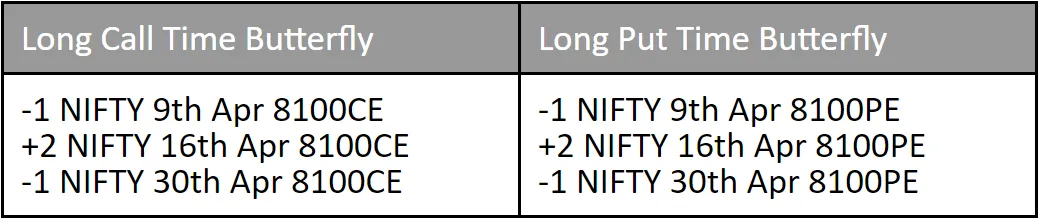
Variations of Time Butterflies:
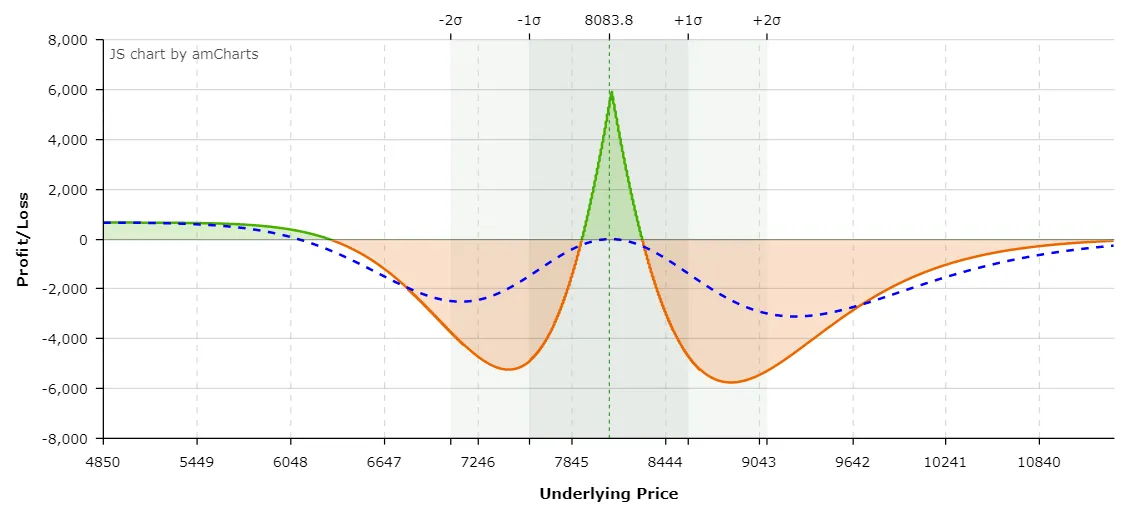
Before we go into more details, Let’s have a look at the payoff graph of a trade setup where –
- Sell NIFTY 9th Apr 8100PE at 216
- Buy NIFTY 16th Apr 8100PE at 330 – 2 Lots
- Sell NIFTY 30th Apr 8100PE at 465.05

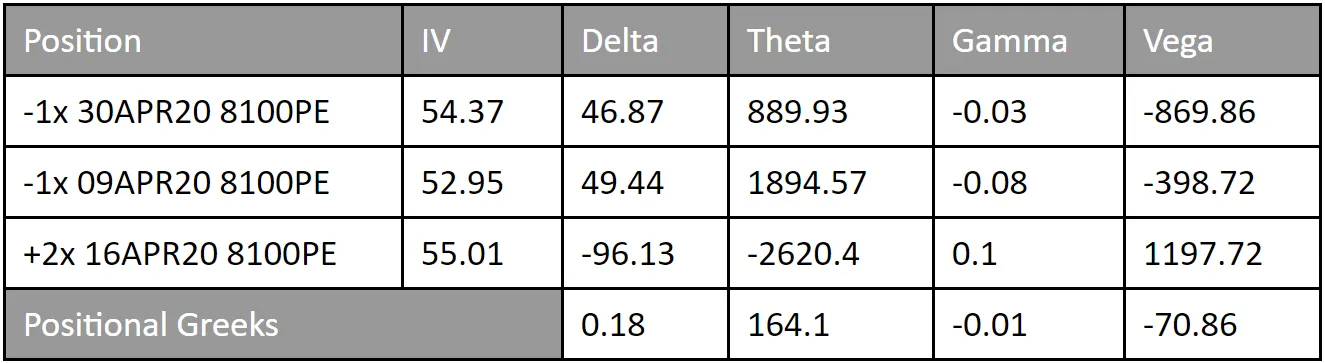
Let’s have a look at the greeks for better understanding –
Here is another visualization –
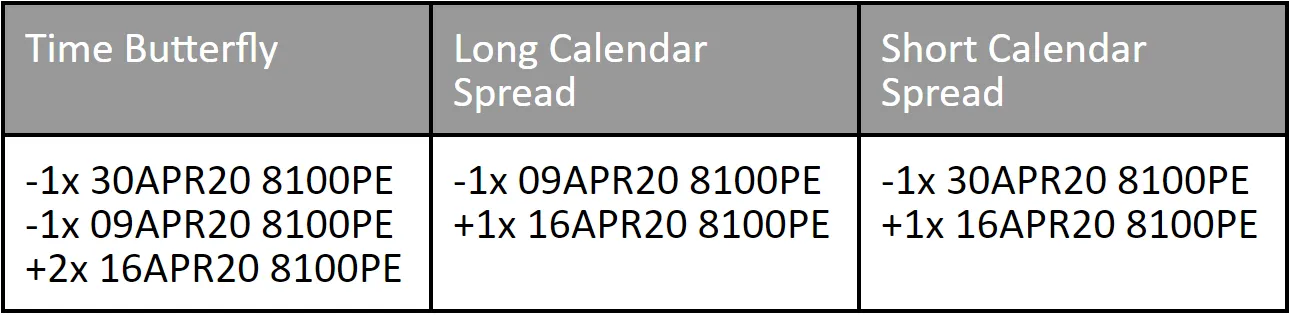
So, basically a Time Butterfly is a combination of a Long Calendar Spread and Short Calendar Spread of different time cycles.
Choice of Strike Price and Max Profit:
Like, Calendar Spreads, The maximum profit is very hard to calculate as we have options of different expiry cycles. It is even harder as we have three different expiry cycles here!
But, the maximum profit happens, in this case of Long Time Butterfly, if all the options remain at the money, as the time passes i.e the spot moves nowhere! In sum, a long time butterfly has characteristics similar to those of a long calendar spread. We shall be discussing the effect of volatility and time in details with more payoff graphs as it has complex outcomes.
How to Calculate Breakeven(s):
- The break-even for a calendar spread cannot be calculated properly due to the different expiration cycles being used.
- All the options can have different implied volatility because we are talking about future volatility as well as the present volatility.
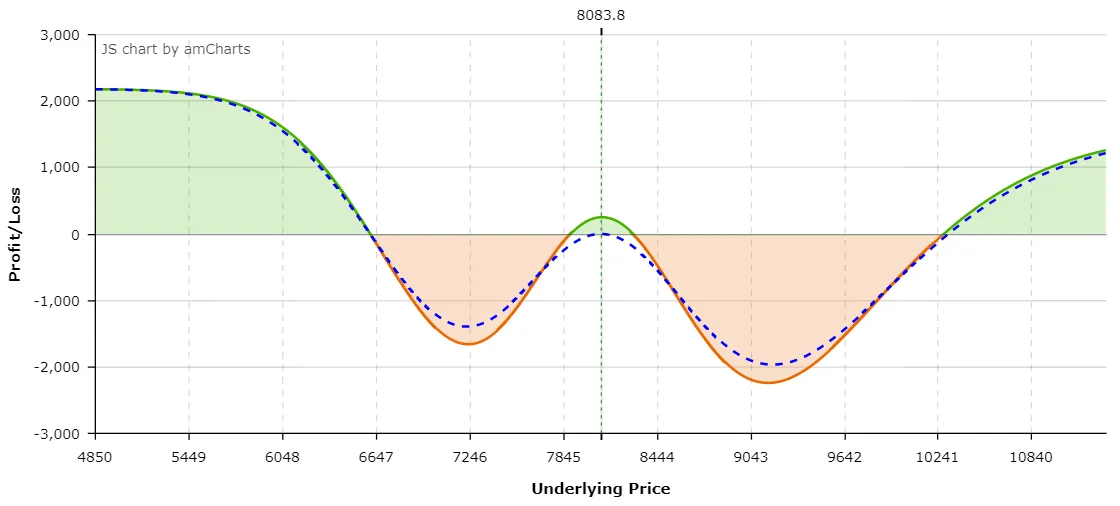
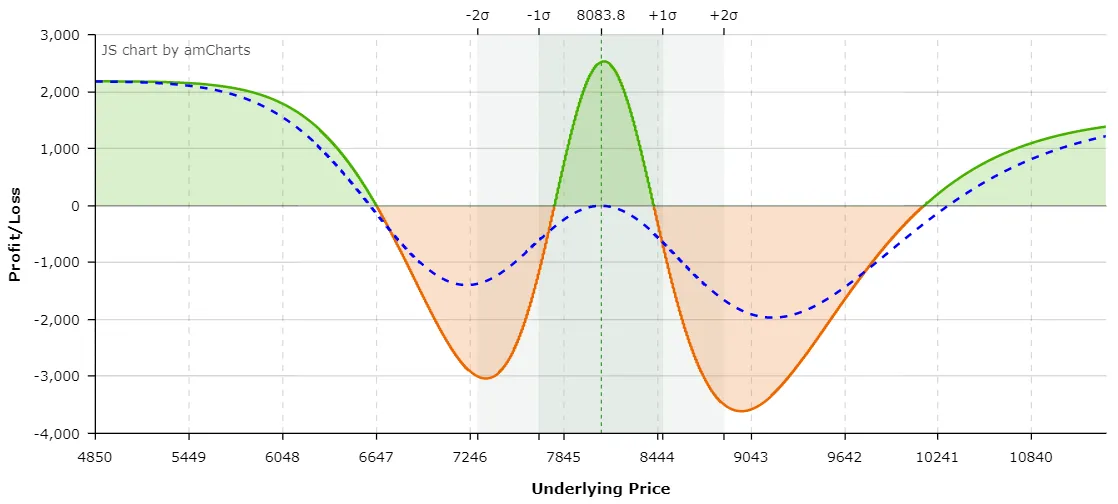
So, Conceptually, there are four breakeven points as we can see in this payoff graph which was being discussed earlier –
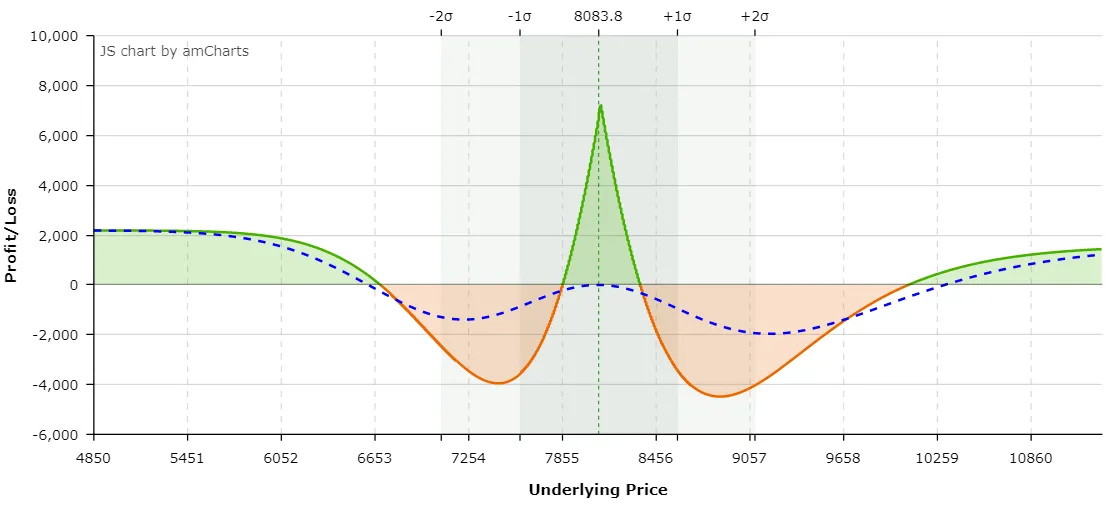
- Point A to B – Loss Zone
- Point B to C – Profit Zone
- Point C to D – Loss Zone
- Below Point A and Above point D there are profit zones.
However, there can be asymmetry based on option prices!
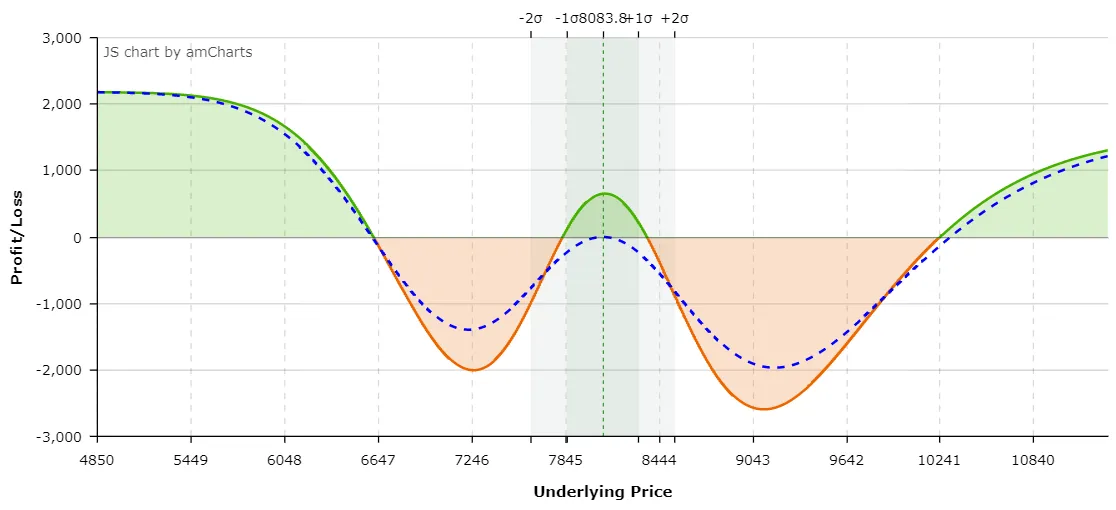
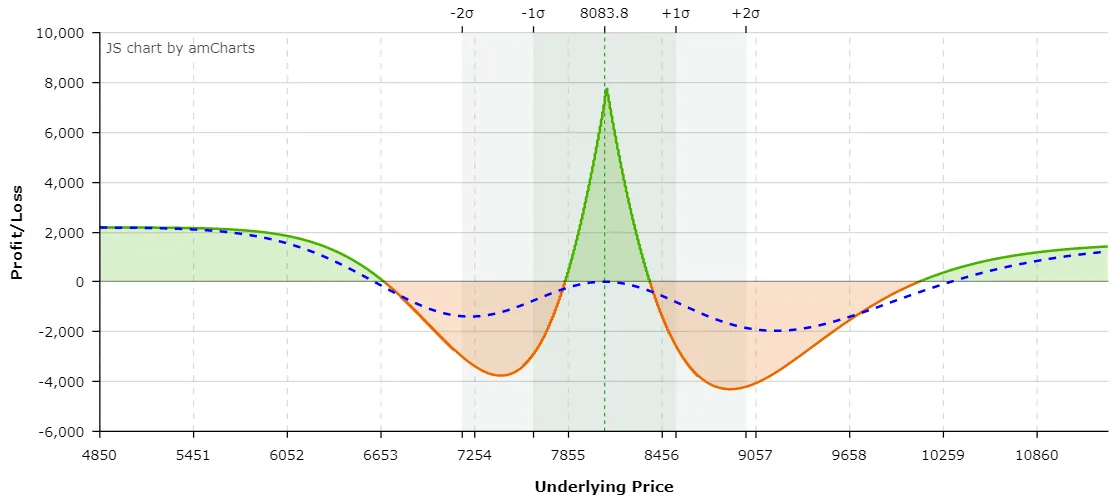
Here is an example of a payoff graph where –
- Sell NIFTY 9th Apr 8100CE at 188.95
- Buy NIFTY 16th Apr 8100CE at 326.5 – 2 Lots
- Sell NIFTY 30th Apr 8100CE at 472.85
In this payoff graph, there is no profit zone in the extreme right i.e. the point D as previously discussed.
We are making the assumption here that the implied volatility of all expirations is the same. If the implied volatility differs across expiration months, a long time butterfly might in fact result in a credit.
This call long time butterfly spread is a credit spread as we can see we are in fact getting premium of 472.85+188.95-(2*326.5) = 8.8 points
Now, How do these break even points constructed?
Similarly, Like we did for long calendar spreads, we made an assumption that there is no change of volatility and we projected the options payoff towards the first expiry and summed them up!
Effect of Time on Long Time Butterfly
To understand the effect of time with this spread, We need to study the payoff graphs.
Payoff Graph when DTE = 4
Payoff Graph when DTE = 3
Payoff Graph when DTE = 2
Payoff Graph when DTE = 1
Payoff Graph when DTE = 0 i.e. expiry day
The IV has been kept the same! The profit amount between B to C increases exponentially as we go near the expiry. Also the loss amounts are also increasing but the impact is not substantial.
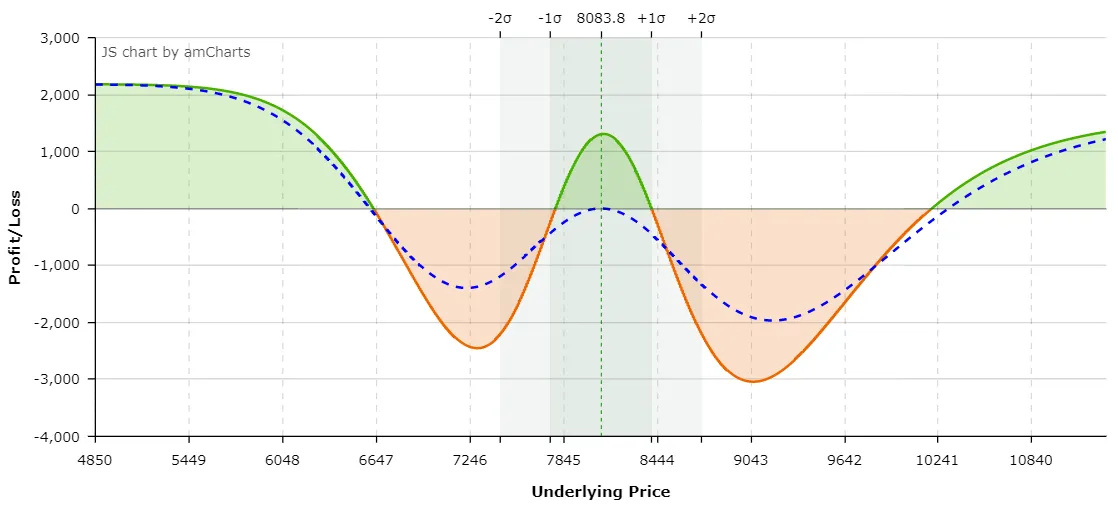
Effect of Volatility on Long Time Butterfly
To understand the effect of volatility with this spread, We need to study the payoff graphs once again. This time, we will study the effect of IV keeping the DTE same. Let’s take DTE = 0 i.e. the expiry day!
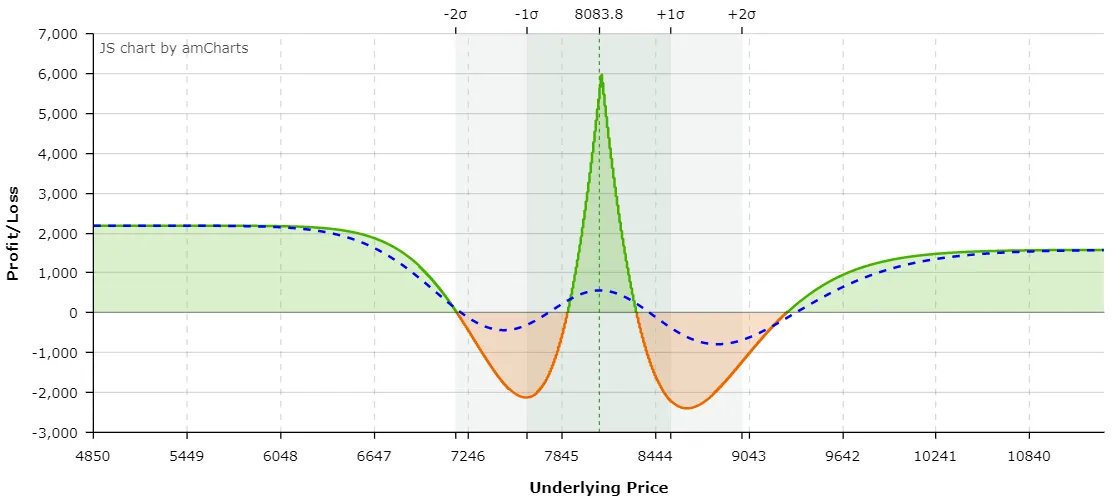
Payoff Graph when IV decreases 30%
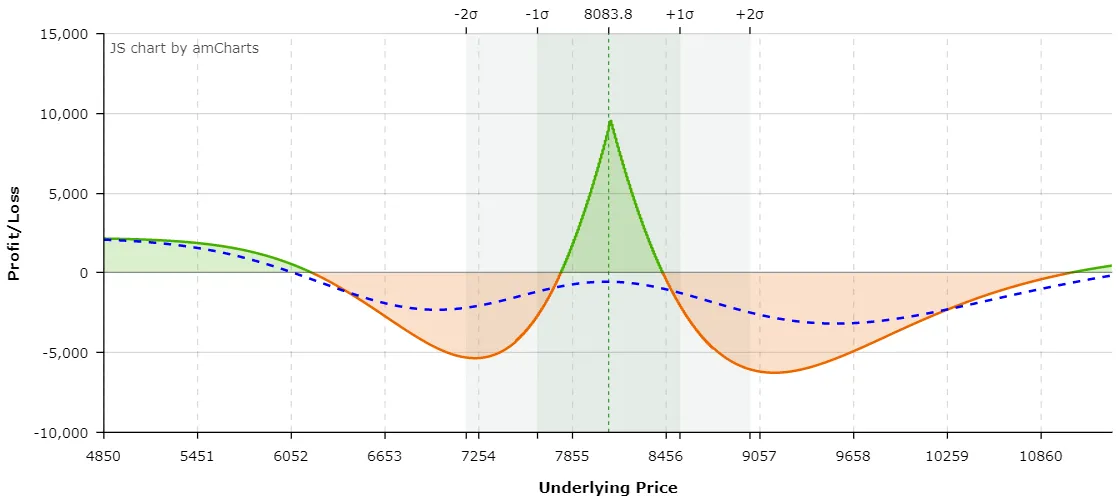
Payoff Graph when IV increases 30%.
There are lots of noticeable changes. It is quite dynamic in that sense!. As the volatility rises –
- The area where loss happens increases huge! (So, The extreme far points where again profit happens gets shifted too).
- The amount of loss gets minimal increment.
- The area where profit happens gets minimal increment.
- The amount of profit increases huge!
- Change of Profit in the farthest area decreases slightly.
Max Loss
This is hard to calculate. This is generally a debit spread but there can be cases of credit spread as well!
Anyways, the loss can not be theoretically more than the difference of premium of the 3rd leg and the 2nd leg. So, in the case where,
- Sell NIFTY 9th Apr 8100CE at 188.95
- Buy NIFTY 16th Apr 8100CE at 326.5 – 2 Lots
- Sell NIFTY 30th Apr 8100CE at 472.85
The max loss will be 472.85-326.5 = 146.35.
But, there can be cases which can make an asymmetric impact!
Effect of Interest Rate Change on Long Time Butterfly
As discussed earlier, Interest Rates affect options having higher expiry cycles more than the ones having near expiry cycles. Also, call options and put options have opposite effects when it comes to interest rate!
An increase in interest rates will reduce the value of a put calendar spread and an increase in dividends will reduce the value of a call calendar spread. But, as said, it is insignificant unless there are options with too far expiry cycles are involved like December options.