Put Ratio Front Spread

Put Ratio Front Spread is a neutral to a bullish strategy with no upside risk. It is doing by selling a far OTM put option to Long Put Vertical Spread. It is also known as the 1PE2PE Strategy.
Setup:
- Buy ATM/OTM Put Option – 1 Lot
- Sell Far OTM Put Options – 2 Lots
Ideal IV Environment: High
Maximum Profit: Distance between the strikes + Credit received
How to Calculate Breakeven(s):
- Upside: None
- Downside: Short put strike – Maximum Profit Potential (Maximum Profit/Lot Size)
Same Strike for Distant OTM Puts:
- If both of the sold distant OTM puts are at the same strike, the strategy remains a Puts Ratio Front Spread.
- This approach simplifies the management and understanding of the position, as both sold puts react similarly to changes in the underlying asset’s price.
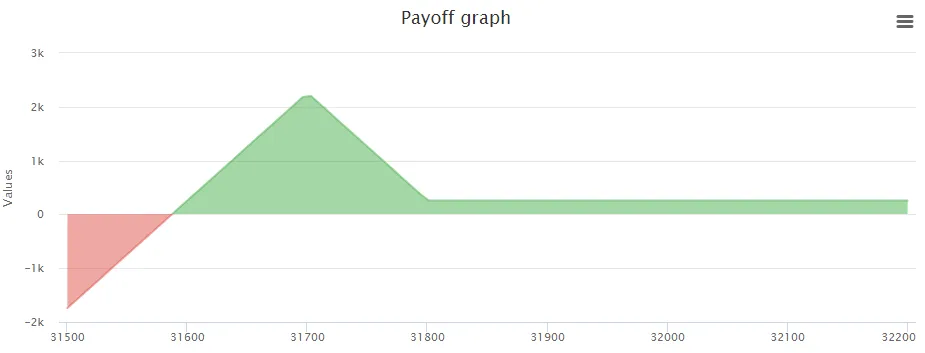
Example:
- Short 31700PE at 42 – 2 Lot
- Buy 31800PE at 71 – 1 Lot
Notes
- Although It sounds confusing, traders use different combinations of nomenclature. So, Front Ratio Call Spread or Call Ratio Front Spread means the same thing.
- Call Ratio Front Spread behaves like a short straddle when it comes to the movement in payoff graphs when the impact of Theta is negligible like when DTE (Date to Expiry) is far.
- Similarly, Call Ratio Back Spread behaves like a long straddle.
- The highest profit happens when there is a movement towards the maximum profit zone near the expiry. But, if there is a significant movement when DTE is far i.e. Theta’s impact is negligible, a Call Ratio Front Spread will do almost similar damage like a short straddle. We will discuss that later with payoff graphs.
The points discussed above are also applicable to the Put Ratio Spreads.
In Short, the Ratio Front Spreads with same strike price for OTM Calls mimic Straddles but limits the risk or the reward in one direction.
Different Strikes for Distant OTM Puts:
- If the sold distant OTM put are at different strikes, it’s still essentially a Put Ratio Front Spread.
- This variation adds a layer of complexity to the strategy. The different strike prices can be chosen to fine-tune the risk and reward profile based on specific market expectations.
Example –
When we construct strangles instead of straddles in a similar manner we have done for Ratio Spread we get the following –
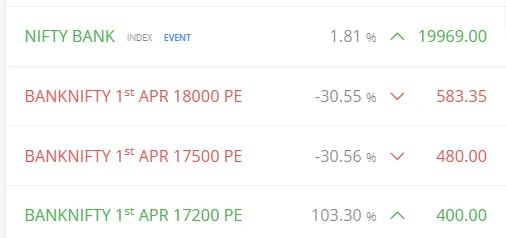
- Short 17500PE at 480 – 1 Lot
- Short 17200PE at 400 – 1 Lot
- Buy 18000PE at 583.35 – 1 Lot
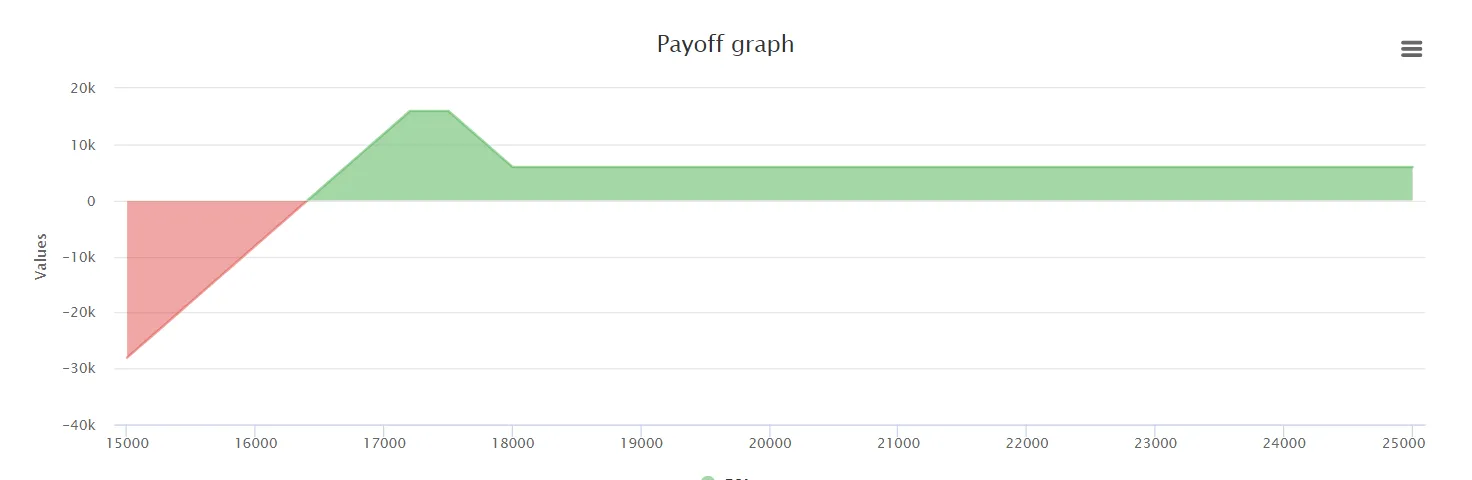
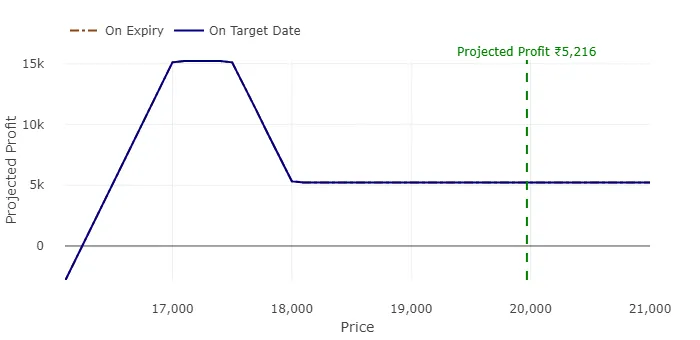
The payoff graph looks like –
Apart from Ratio Spread and Frontspread, This specific example can also be called –
- Short Spread as it is a net credit spread.
- Put Spread as it only has put options.
- Bearish Spread as the bet for market direction is downside.
The maximum loss is in downside. So, if we take a deep OTM PE buy, it will become a Broken Wing Put Condor.
So, Our Lower Breakeven point in this strategy is 16300. It means if it stays above 16300 on expiry day, We will not be in loss.
Let’s talk about the Lower BEP of what happens to it on the next trading day?
- How does the unrealized loss work here?
- Do we get a huge profit if a sudden downside move happens?
However, note that “DTE” is an acronym for Days to Expiry.
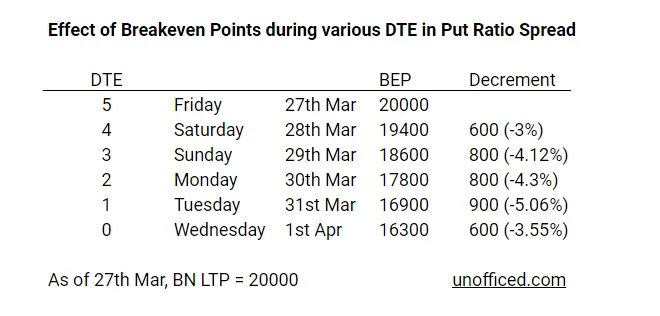
So, as long as the BankNIFTY index doesn’t fall steadily more than that %, the unrealized losses will not pop up. It is unusual to fall like this as anyways the breakeven point of 16300 where actual realized loss may happen is nearly 18.5% from the current point.
But, last week, BN fell 18.5% in the Friday itself shooting unrealized loss off the charts! Now, as we have seen how the unrealized loss works here. We shift to the next question – “Do we get a huge profit if a sudden downside move happens?”
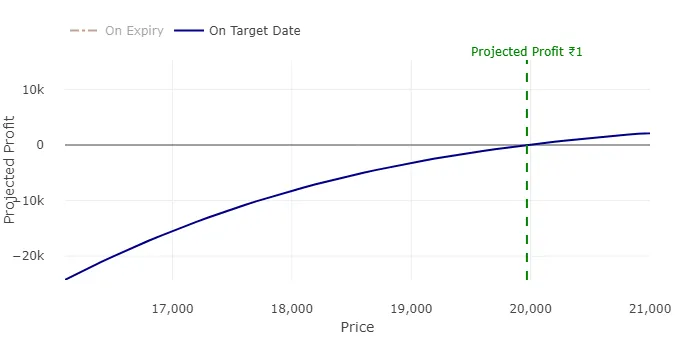
Let’s see the pay off graph each day assuming the IV stays the same! The above image is the payoff graph of Friday.
Saturday (The market is closed so we can skip thinking about this)
Sunday (The market is closed so we can skip thinking about this)
When we take the trade, the loss is happening when we breach the BEP on Thursday but in this case, we are studying unrealized losses in previous days. Like, If BankNIFTY doesn’t break 17800 this position will show a profit on Monday.
But, this spread has more options sold (-gamma,+theta,-vega) than bought so the effect of movement of underlying affects very badly when the effect of Theta hasn’t kicked in prominently.

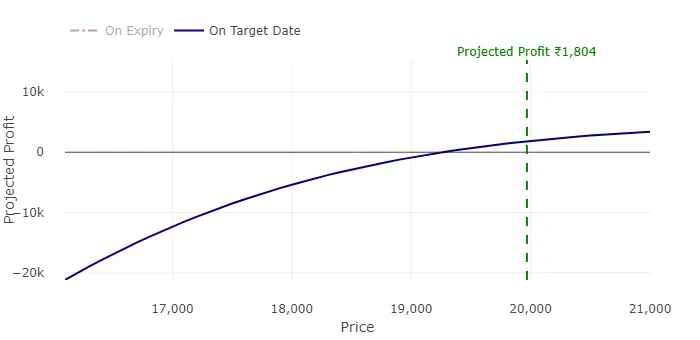
Monday
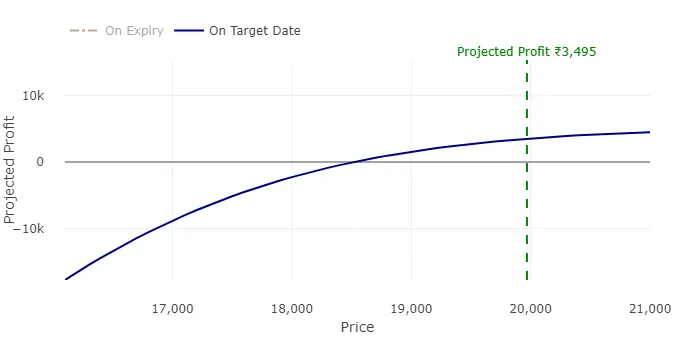
Tuesday
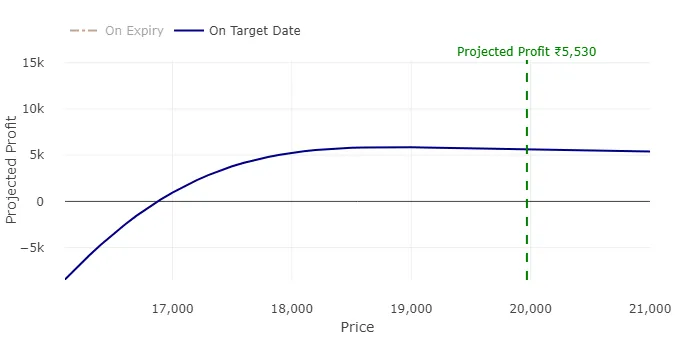
We can see the effect of Theta here. There is a sudden jump in the profits as well as the breakeven points. This is non symmetrical.
Till before today, the options payoff was almost the same as the payoff of short straddle over various DTEs. So, when constructing this type of Long Christmas Trees. (It is called the Long Put Christmas Tree because it has unlimited loss towards the downside. It has nothing to do with credit or debit as it will always be credit spread).
However, if the strategy is executed near expiry, it will be a debit spread as the impact of theta and vega is more on the OTM strike prices as they have more extrinsic value. So, if it is executed near DTE, change in IV and change in spot will positively impact the payoff.
In fact, we can also buy more OTM options with the premium received from ATM options. Anyways, this is the final payoff graph that happens on Wednesday. (The expiry is on Wednesday in case of this contract.)
A movement towards the downside will give maximum profit. But, as said, the more it is near to DTE, the better the chances of profit maximization.