Markov Chains in Stock Market

In Our Last Chapter, We have discussed about Stochastic Modeling in Stock Market.
Markov Chain:
A Markov Chain is a stochastic process that undergoes transitions from one state to another in a state space, and it is memoryless, meaning the next state depends solely on the current state and not on the sequence of events that preceded it.
The Markov Property - Memory Less Function
The probability of transitioning to any particular state is dependent solely on the current state and time elapsed, and not on the sequence of events that preceded it.

The cornerstone of a Markov chain is its unique property: the system’s future state depends solely on its current state, independent of the path taken to reach that state. This characteristic, often termed the “Markov Property,” embodies a memoryless quality, suggesting that the future is independent of the past, given the present.

- The Markov property means that the evolution of the Markov process in the future depends only on the present state and does not depend on past history.
- The Markov process does not remember the past if the present state is given. Hence, the Markov process is called the process with memoryless property.
Example –
Suppose Nifty was up in x1 day, down in x2 day, down in x3 day, neutral in x4 day. How we should determine the probability that the state of x5 day will be up? (x1,x2,x3,x4 are assumed to be consecutive four trading days. And, by neutral, We meant consolidation phase.)
Answer –
The underlying question here is about forecasting the state of Nifty on day x5 based on its performance over the previous four days using the Markov Chain theory.
In a Markov Chain, the probability of transitioning to a new state only depends on the current state and not on the sequence of states that preceded it. This property is known as memorylessness. Here’s a deeper explanation of the example given:
- State Identification: Firstly, the different states are identified. In this case, the states are defined by the trend of Nifty: Up, Down, or Neutral.
- Transition Probabilities: Transition probabilities are the probabilities of moving from one state to another. These probabilities are generally derived from historical data.
- Current State: The current state is the state on day x4, which is Neutral.
- Future State Prediction: The objective is to predict the state on day x5.
According to Markov Chain theory, the probability of the state on day x5 being Up is solely dependent on the transition probabilities from the state on day x4 (Neutral) to all possible states on day x5.
In the given diagram, it’s stated that referring to the Markov Chain diagram, the probability of an upward trend after a neutral day is 50%.
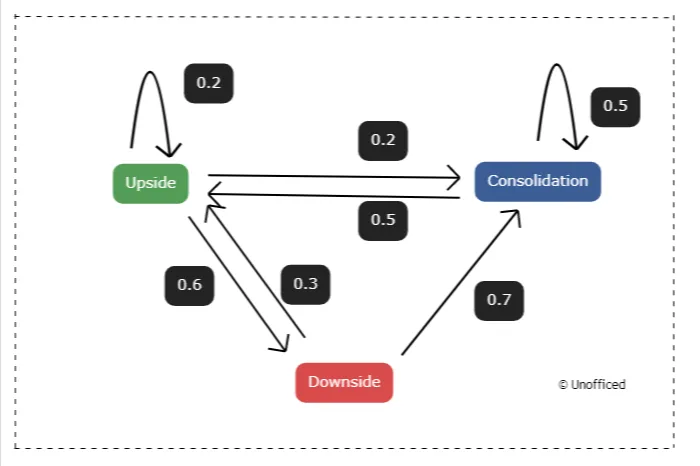
This means, based on historical data and the transition matrix, there’s a 50% chance that Nifty will transition from a Neutral state on day x4 to an “Up” state on day x5. This process encapsulates the Markov Chain theory’s application to the stock market, particularly for predicting Nifty’s performance on day x5 based on its state on day x4.
Transition Matrix:
A transition matrix is a matrix where each element (i, j) represents the probability of transitioning from state i to state j.
For example, if state i is Neutral and state j is Up, the element (i, j) in the transition matrix is the probability of transitioning from Neutral to Up. The term “transition matrix” is used because this matrix specifically details the transitions or changes from one state to another within a system, outlining the probabilities of these state changes.
The probabilities in the Transition Matrix is also known as Transition Probablities.
Pseudo-randomness
Markov Models serve to describe processes that, although random, are dependent on their current state.
Thus, they represent processes that aren’t entirely random and independent, leading to the usage of the term ‘Pseudo-random’ to describe their nature.
Note on Probability Theory:
- The aggregate of the weights of the outgoing arrows from any state equates to 1.
- This is essential as these weights represent probabilities, and in order for these probabilities to be coherent, their sum must equal 1.
Markov Chain Model
The terms “Markov Chain Model” and “Markov Chain” are often used interchangeably, but they can be distinguished in certain contexts.
Markov Chain Model: This term typically refers to the theoretical framework or the mathematical model that describes a system undergoing transitions from one state to another in discrete time steps. It encompasses the principles, assumptions, and mathematical formulations that define how the Markov process operates.
Markov Chain: This often refers to a specific instance or realization of the Markov Chain Model. It’s the actual sequence of states or events generated according to the rules and probabilities defined by the Markov Chain Model.
In summary, while the “Markov Chain Model” is the broader conceptual and mathematical framework, a “Markov Chain” is a specific sequence or series of states that occur within the framework of this model.
Still having trouble to understand? Alright, imagine you have a game with a set of rules (that’s the Markov Chain Model) and then actually playing the game (that’s the Markov Chain). The model is like the rulebook that tells you how to play, and the chain is like playing the game, moving from one step to the next following those rules.
Mathematical Representation of Markov Chain
There are three measures we need to be aware of so we may construct a Markov chain:
- States: All the states (occurrences) within the state-space \( S \) of the dynamical system
- The initial state distribution: The initial probability distribution of the starting state. It is encoded into a column vector denoted as \( q \)
- State transition probabilities: The transition probability of moving from one state to another. It is encoded into an \( s \)-by-\( s \) matrix denoted as \( P \)
$$
S = \{s_0, s_1, s_2, \ldots, s_S\} \Rightarrow \text{State Space } S
$$
$$
q = [q_1, q_2, \ldots, q_S] \Rightarrow \text{initial probability distribution, } q
$$
$$
P = \begin{bmatrix}
p_{11} & p_{12} & \ldots & p_{1S} \\
p_{21} & p_{22} & \ldots & p_{2S} \\
\vdots & \vdots & \ddots & \vdots \\
p_{S1} & p_{S2} & \ldots & p_{SS}
\end{bmatrix} \Rightarrow \text{Transition State Matrix, } P
$$
$$
\sum_{j=1}^{S} p_{ij} = 1, \text{ each row } = 1
$$
In the context of the transition matrix \( P \), each row corresponds to the current state \( X_t \), and each column to the next state \( X_{t+1} \). The matrix element \( p_{ij} \) denotes the conditional probability that \( X_{t+1} = j \) given the current state \( X_t = i \).
This probability quantifies the likelihood of the system moving from state \( i \) to state \( j \). The definition of \( p_{ij} \) is as follows:
$$
p_{ij} = P(X_{t+1} = j \,|\, X_t = i) \, \forall i, j \in S \text{ and } t = 0, 1, 2, \ldots
$$