The Grasim Crash
This is an Outdated Article. It was written long ago and in an amateurish way. Please refer up to new content.
Within the day trading community of #daytraders on our slack channel, there is a wealth of information exchanged daily. However, I understand that many newcomers may find it challenging to absorb all the details shared. Hence, I’ve decided to provide a summary of my daily trading notes for greater accessibility and clarity.
I personally enjoy engaging in scalping activities with Grasim due to its excellent liquidity. 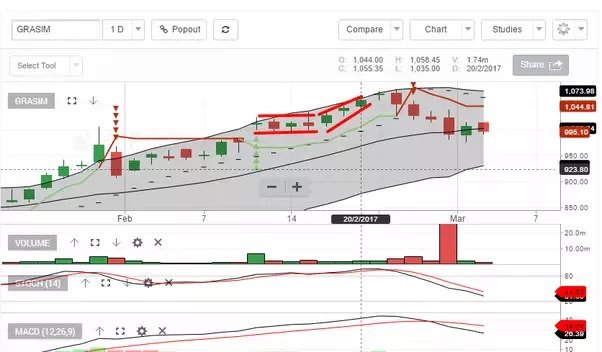
The high and low of each day getting closed higher than the high and low of the previous day. It means today’s high is higher than yesterday’s high and today’s low is also higher than yesterday’s low.
The Stoch(14) indicator tells it is pureand It was purely oversold.
The candles were also converging forming a pennat. This is a compression structure and often results in breakdown. Even, if you think as a psychological prespective, You can see the bulls are struggling to push it more up causing the converging pattern.
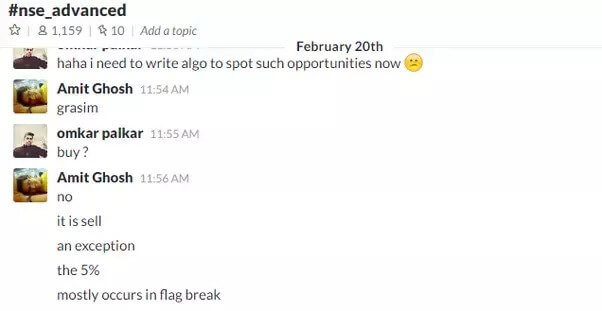
In the subsequent trading session, Grasim formed a doji candlestick pattern. Seeing this, I opted to sell futures contracts, anticipating the retracement due to long covering. Doji is a sign of indecision. As the stop loss is at the high of the candle and the doji candle being tightly compressed, it makes the stop loss smaller.
So, the risk becomes small. Although the chance of hitting stoploss becomes high. The short has not triggered yet right? The previous day’s low is not broken. Neither the pennant is broken. But the risk is extremely small.
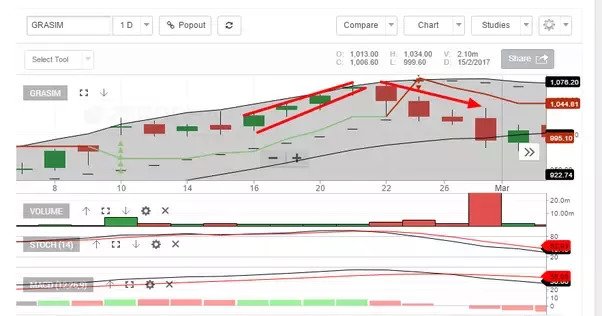
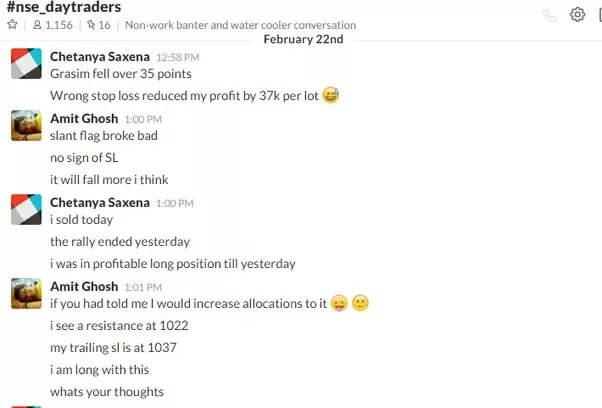
The slant flag or so called pennat broke the next day.
Party
Uses of Middle Bollinger
But then it was approaching the middle Bollinger which is also known as Median Bollinger Band. 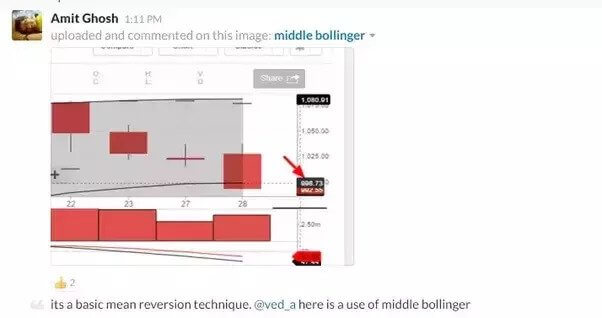
The median Bollinger band plays a pivotal role as a significant support and resistance level in our analysis. At this juncture, we must consider three possible scenarios:
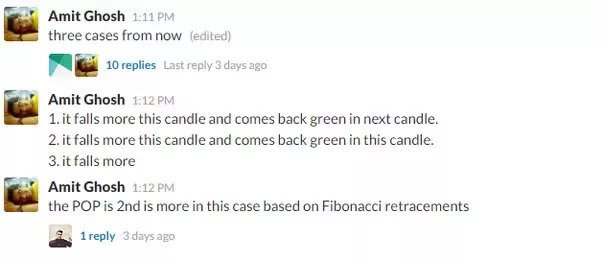
- The price falls further during the current candlestick session but subsequently reverses to close in green during the next candlestick session.
- The price experiences a further decline within the current candlestick session but then rebounds and closes positively within the same session.
- The price continues to fall further without exhibiting a notable reversal.
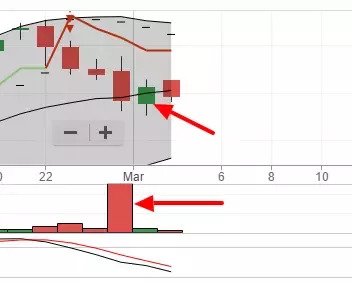
It formed a stren green candle on the top of the median bollinger band showing weakness among the bears and thats where I exit the sell trade!
To make an informed decision about which trading strategy to pursue, we need to cross-reference our analysis with various technical indicators and fundamentals.
By meticulously applying the knowledge and tools acquired through technical and fundamental analysis, we can enhance our predictive abilities and assess the likelihood of different outcomes. It’s important to emphasize that these predictions are associated with probabilities, highlighting the inherent uncertainty in financial markets.
Please note the term – Probability!
Closest Strategy:

