The Grasim Crash

The Setup
This case study examines a historical short trade in Grasim futures on the daily chart. The setup is a classic bearish reversal pattern that combines multi-day price compression with a key candlestick signal, demonstrating how to anticipate and trade a trend exhaustion.
Trade Analysis
1. The Pre-Trade Condition: Uptrend and Compression
In the days leading up to the trade, Grasim was in a clear uptrend, marked by a series of higher highs and higher lows. However, signs of exhaustion were appearing. The price action began to compress into a pennant formation, indicating a struggle between bulls and bears. Concurrently, the Stochastic (14) indicator was in the overbought zone, suggesting the upward momentum was weakening.
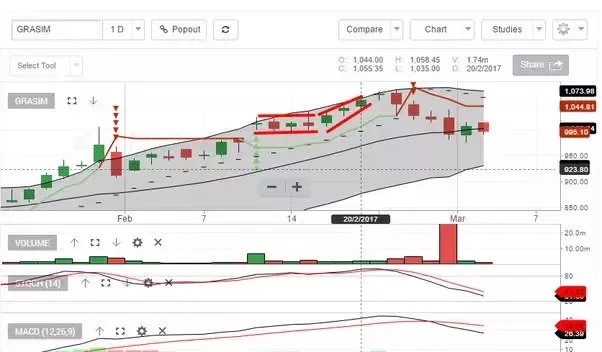
2. The Entry Signal: A Doji at the Top
The session immediately following the compression produced a Doji candlestick. A doji represents indecision in the market and, when appearing at the top of an uptrend, often acts as a bearish reversal signal. This provided a low-risk opportunity to initiate a short position by selling futures contracts.
3. The Breakdown and Profit Run
The short trade was initiated in anticipation of a breakdown. The next day, the price decisively broke below the pennant’s lower trendline, confirming the bearish thesis. The break triggered a wave of selling, including long covering from trapped bulls, leading to a sharp price decline.
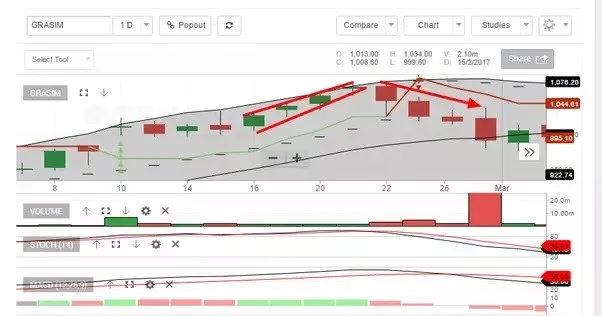
The subsequent move was swift and profitable, demonstrating the power of trading with the momentum released from a compression pattern.
4. The Exit: Support at the Middle Bollinger Band
As the price fell, it approached the middle Bollinger Band (the 20-period simple moving average). This level is a dynamic and significant area of potential support or resistance. When a stock is in a strong downtrend, a bounce from the middle BB is a common occurrence and presents a logical place to take profit on a short position.
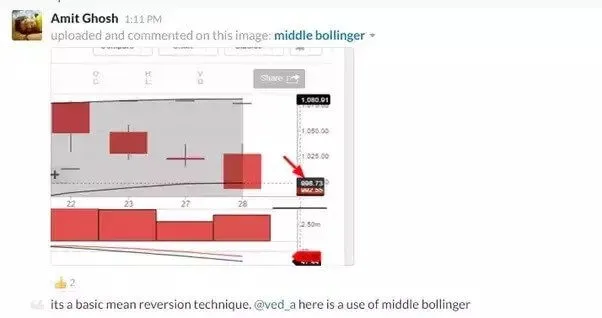
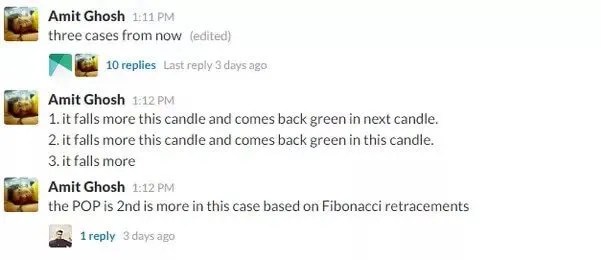
At this juncture, a trader should anticipate one of three scenarios:
- The price breaks through the middle band and continues to fall.
- The price touches the middle band, bounces, and closes higher within the same session (a hammer or pin bar).
- The price closes below the middle band, but the next session sees a reversal and closes back above it.
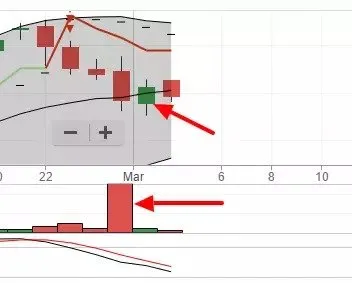
In this case, the bears showed signs of weakness. The price touched the middle band and a strong green candle formed, indicating that buyers were stepping in.
This bullish reversal candle was the signal to exit the short trade and secure the profits.
What This Trade Teaches
- Confluence of Signals: The highest probability trades occur when multiple technical signals align. Here, a chart pattern (pennant), a candlestick signal (doji), and an indicator (overbought Stochastic) all pointed to the same outcome.
- Risk-Defined Entries: Candlestick patterns like the doji provide clear and tight levels for placing stop-losses, allowing for trades with a favorable risk/reward profile.
- Logical Profit Targets: The middle Bollinger Band is a reliable, dynamic level to use as a profit target for reversal trades. Waiting for price to reach it and show signs of reversal is a disciplined exit strategy.
Takeaway
After a sustained trend, look for signs of compression and exhaustion. A reversal candlestick pattern within this compression provides a high-probability, low-risk entry, with the middle Bollinger Band serving as a logical first profit target.