Analysis of The Market – I

Siemens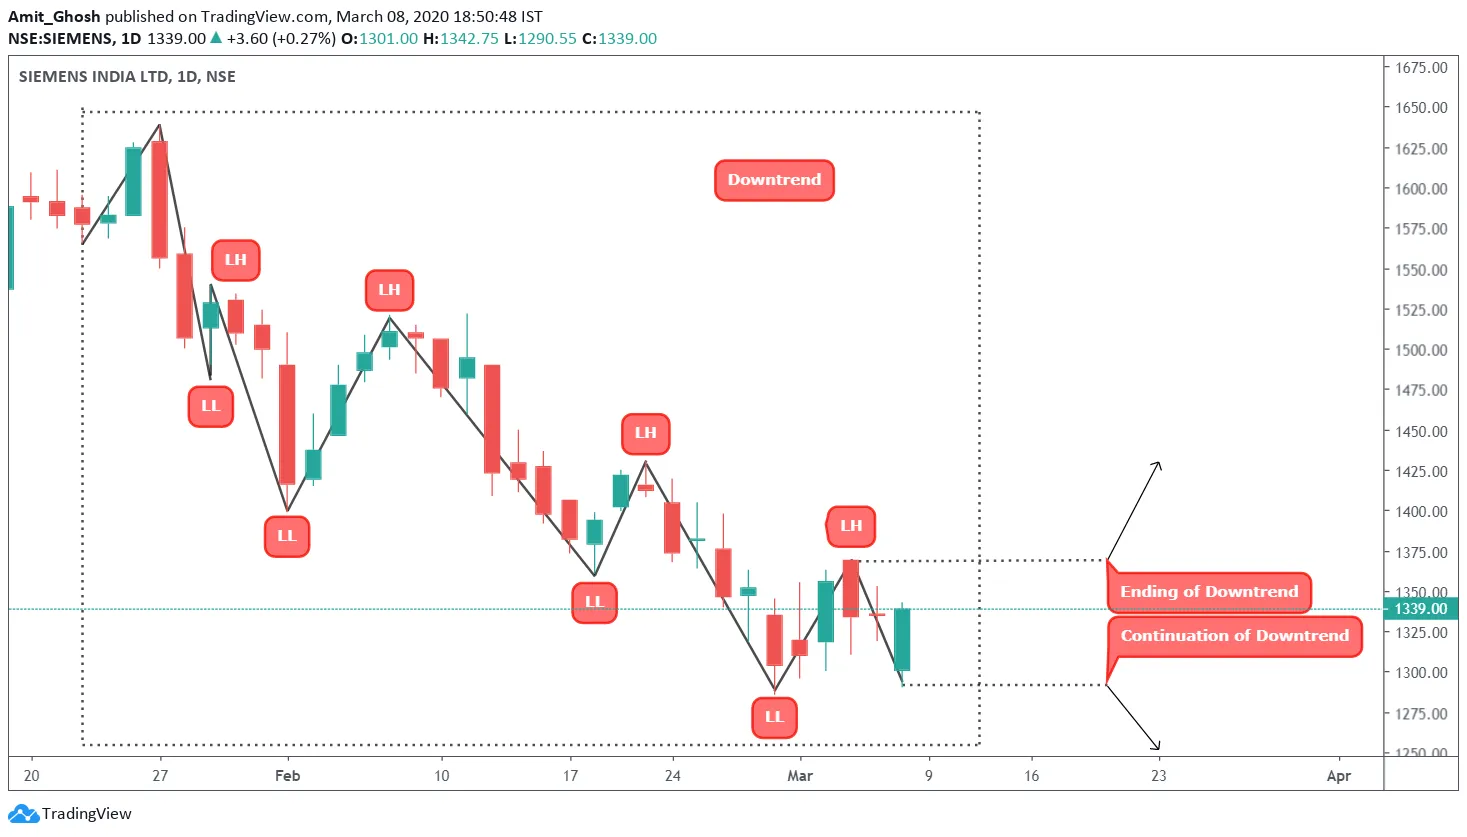
In D timeframe, Siemens is in a downtrend. In the previous examples, We have used our own Bounce indicator or ZigZag indicator to identify the swing chart.
But, it is always better to draw the swing chart by hand. It lets us assign an emotional value towards each candle that is formed. Anyways, that’s what price action is all about!
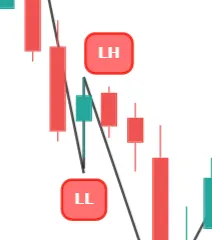
As we can see, the candle which we declared as both lower high and lower low is definitely a swing low but it is not a swing high! But, if you see the distribution of the preceding and succeeding candles, the psychology behind the candle is quite fascinating!
First of all, it is a green candle showing strength after a huge fall (as you can see from the huge tail of the green candle); the next candle is an inside bar that shows compression! The high of the previous candle of an inside bar i.e. the green candle is always an important mark and does definitely fill the purpose of Lower High.
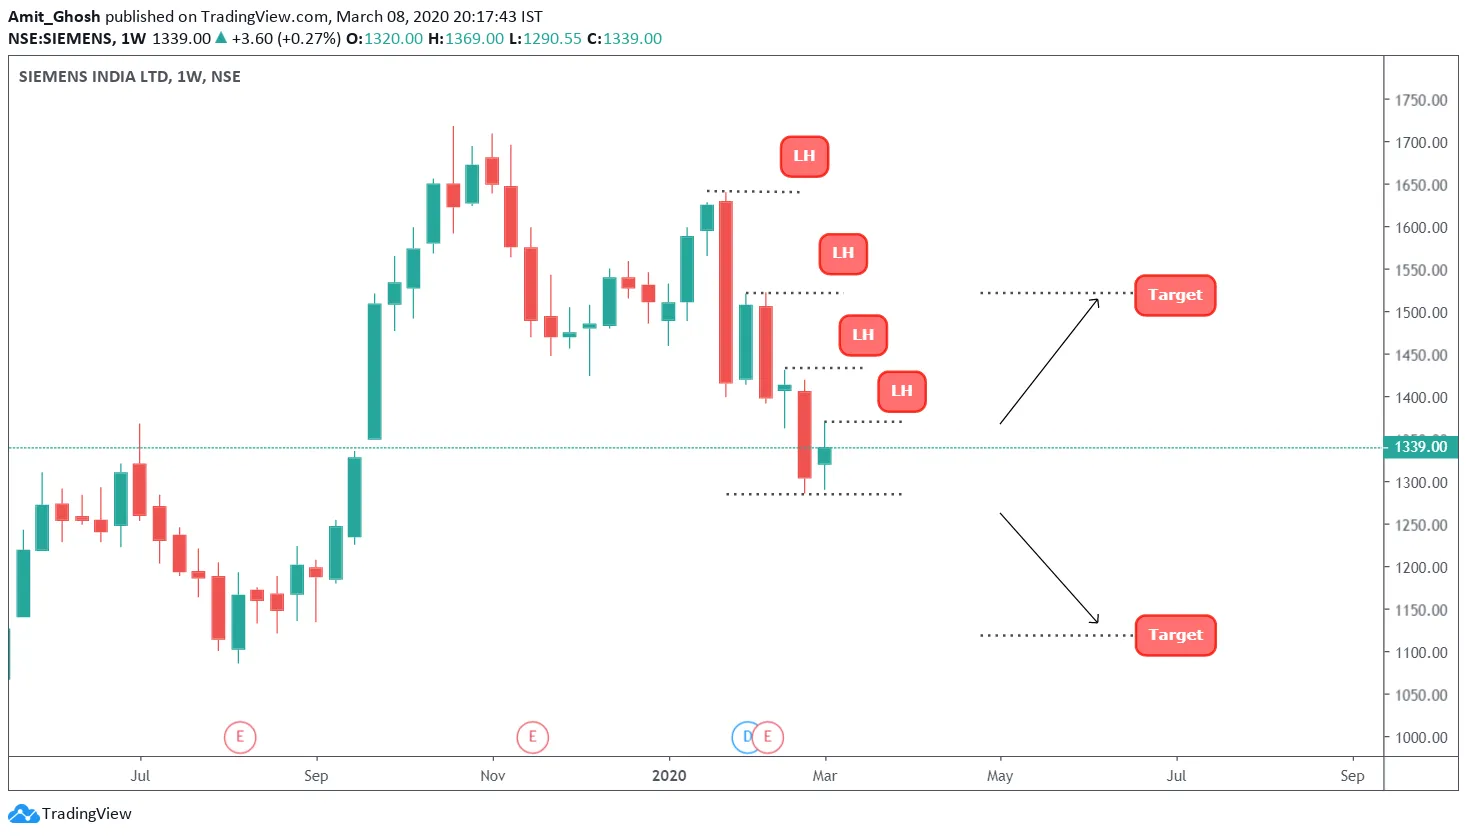
But, if we check the chart of Siemens in W frame, We see an inside bar as well as at the intersection of two important support lines.
Again, if we check using Bounce theory, the Lower high will be the same as the high of the inside bar resulting in the same trade idea. Anyways, all theories of price action tell the same thing in the same time frame.
RBL Bank
https://in.tradingview.com/chart/RBLBANK/M6sKF4dC-Bounce-RBL-Bank-Buy-Idea/
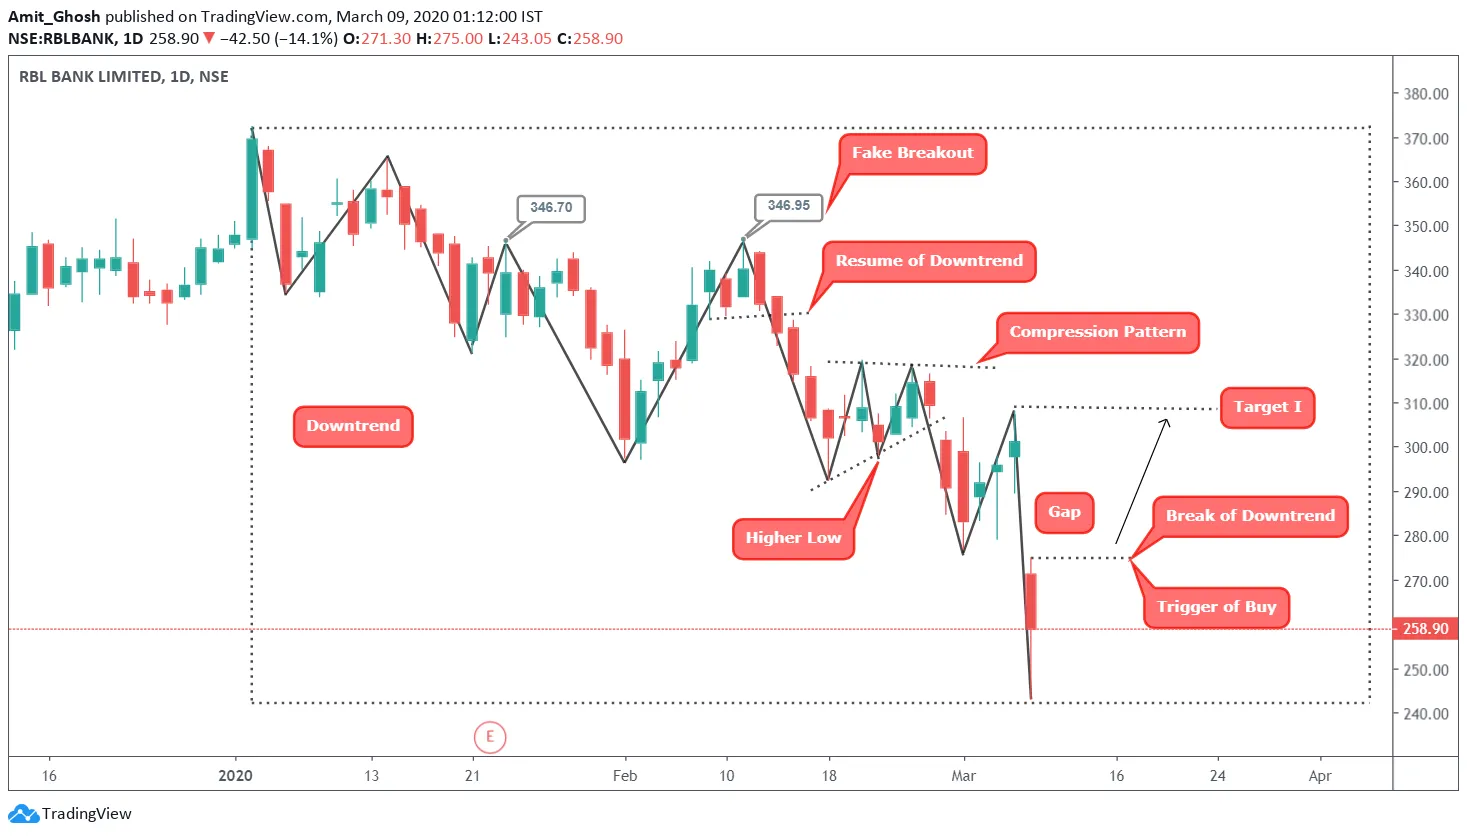
If we follow up RBL Bank closely and forego one incident of fake breakout created by .25 points, it is in a downtrend. In the middle, we can also see it formed higher low leading to a compression pattern and broke down further continuing its journey towards the downside.
On Friday, it gapped down with the rest of the market, due to fear arisen by Yesbank’s fate, the market decided to price in the panic of people.
Now, We have a gap. If that is breached, it will trigger short covering because the extent of the gap is quite huge here! We can safely consider the high of the candle succeeding the gap down as an equivalent of higher high.
Although the market has priced in extra risk premium with a magnificent red candle, the better choice will be to trade with less exposure than usual if the trade setup triggers because of the turmoil of fundamental events.