Bill Williams Market Facilitation Index (BW MFI) Indicator
- What the MFI indicator is.
- What the MFI indicator shows.
- How to use the MFI indicator.
Market Facilitation Index (BW MFI) Indicator
The Market Facilitation Index Indicator or MFI is a volatility indicator. Traders use it to measure the strength or weakness of movements in an asset’s price.
- It helps them decide whether or not a trend in an asset’s price is strong enough to justify entering a trade.
- It can also indicate when a new trend might be about to start and when to totally avoid entering any trades.
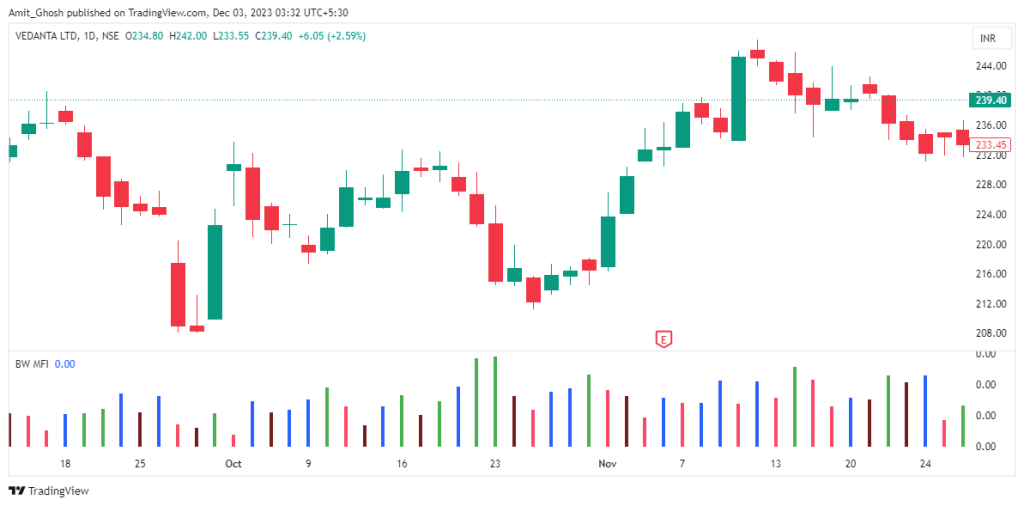
Because it measures market cycles, you can use the MFI indicator on all timeframes and in all market conditions. The MFI indicator looks at the change in size of price movements and the rising and falling of volume. It then uses a system of color-coded bars to indicate the strength of a trend in an asset’s price.
The indicator offers signals based on the relationship between changes in price volatility and trading volume.

The color-coded indicator similar to the one found in the MT4 Platform’s BW MFI Indicator is not available by default in TradingView.
This following script replicates the features of the BW MFI Indicator, originally developed by Bill Williams, hence the name “BW MFI.” It’s important to note that when you come across “MFI” in TradingView, it usually refers to the “Money Flow Index” indicator, which is different from the Bill Williams’ Market Facilitation Index.
					 @version=5
//Dexter
indicator(" Bill Williams Market Facilitation Index", shorttitle="BW MFI", overlay=false)

// Calculate the Market Facilitation Index
mfi = (high - low) / volume


// Custom colors
custom_brown = color.new(#721f1f, 0) // Define brown color
custom_pink = color.new(#fd4967, 0) // Define pink color


// Define color conditions based on Bill Williams' methodology
green_f = ta.change(mfi) > 0 and ta.change(volume) > 0
fade_f = ta.change(mfi) < 0 and ta.change(volume) < 0
fake_f = ta.change(mfi) > 0 and ta.change(volume) < 0
squat_f = ta.change(mfi) < 0 and ta.change(volume) > 0

// Assign colors
b_color = green_f ? color.green : fade_f ? custom_brown : fake_f ? color.blue : squat_f ? custom_pink : na


// Plot the MFI as a histogram
plot(mfi, color=b_color, style=plot.style_histogram, linewidth=4)
What the MFI indicator shows
Green Bar
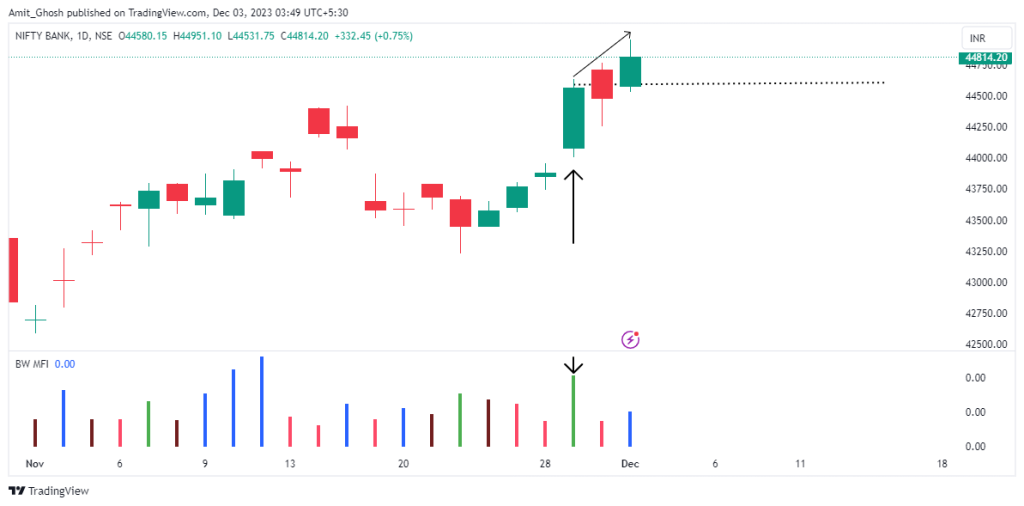
- A green bar occurs when price moves are growing and volume is increased.
- It indicates that traders are entering the market in the direction of the trend and it is gaining strength.
- As a result, a green bar could indicate a good time to enter the trades in the direction of the trend or close trades that are open against the trend.
- It is important to remember that the MFI indicator does not show the direction of price.
Brown Bar / Fade Bar
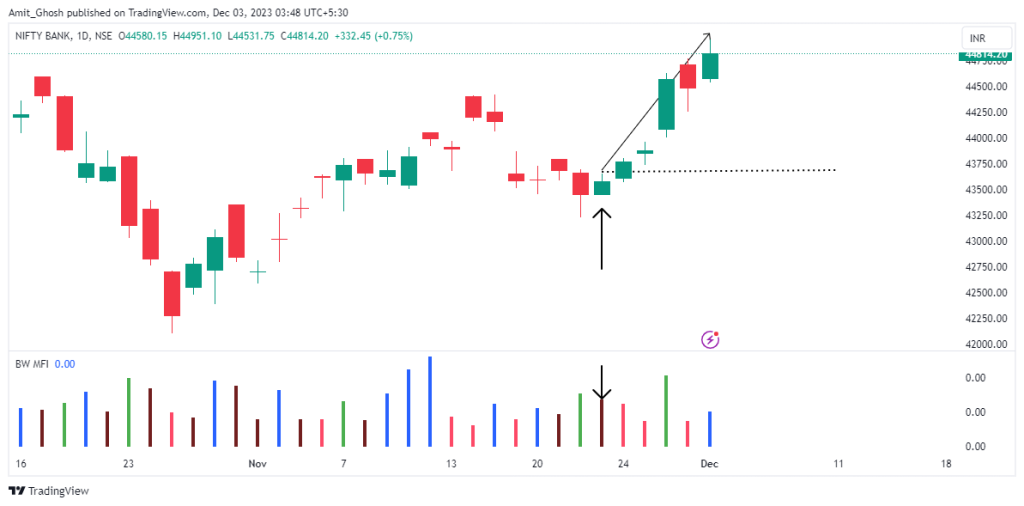
- A brown bar shows weakening momentum.
- It indicates that traders are getting out of the current trend and that it may be coming to an end.
- As a result, a brown bar could indicate a good time to avoid entering trades in the direction of the trend.
- Further, several brown bars in a row might indicate a reversal is about to happen.
Blue Bar / Fake Bar
- A blue bar shows price moves are growing and volume is lowered.
- It indicates that current price action could be due to speculators using one-off large to manipulate illiquid markets and that price moves might not last long.
- As a result, experienced traders know that a blue bar could indicate a good time to avoid entering trades while beginner traders get sucked in and lose money.
Pink Bar / Squat Bar
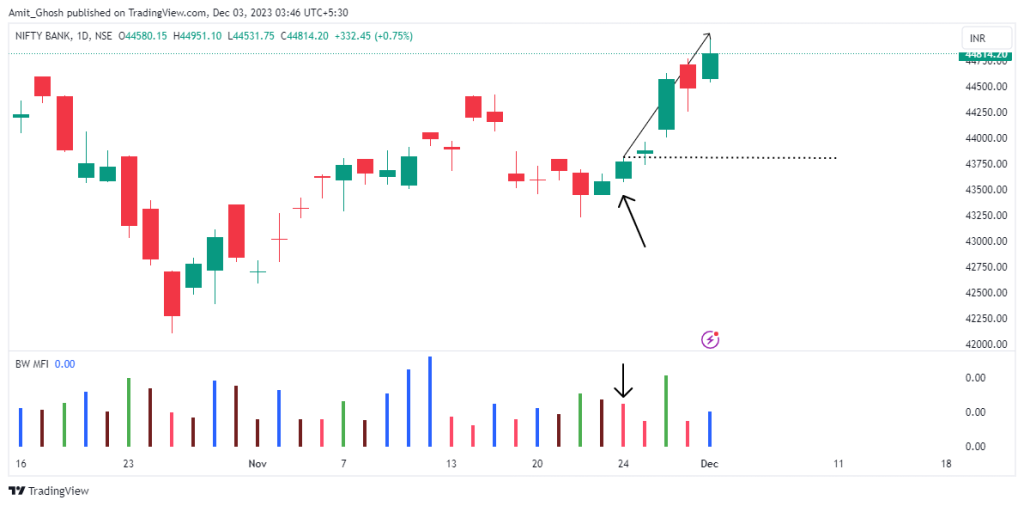
- A pink bar indicates price moves are shrinking but volume is up.
- This suggests that there is plenty of market interest, but a battle between bulls and bears means that price does not yet have a clear direction.
- Once the bulls or the bears take hold, price can rise or fall rapidly.
How to use the MFI Indicator
Blue Bar / Fake Bar

A blue bar is a fake bar and it appeared in the green candle that formed after lots of red candle.
It told “not to enter a long trade” in that place. It ended up as a minor retracement in a downtrend and a mere lower high. The price fell afterwards. This chart shows how BW MFI indicator helped us avoiding a trap.
Pink Bar / Squat Bar

Brown Bar / Fade Bar

Green Bar

Conclusion
- The MFI indicator is a volatility indicator.
- It measures the strength of price movements.
- It uses a combination of green, blue, brown and pink color-coded bars to help indicate potential market behavior.

