Analyzing Bank of India with Bollinger Bands Trading Strategy

Analysing a Bank of India Trade with Bollinger Bands
This case study examines a series of trades in Bank of India futures on a 15-minute timeframe from early May 2017. We will first analyse the application of the Bollinger Ride Strategy (BRS), identify its limitations on this timeframe, and then see how the specific conditions led to a high-probability 3BB Strategy setup.
Attempting the Bollinger Ride Strategy (BRS)
The initial approach was to apply the BRS, which involves entering on a candle touching the +1SD band and exiting when the price touches the 20-period simple moving average (the median line). Here are the first two attempts:
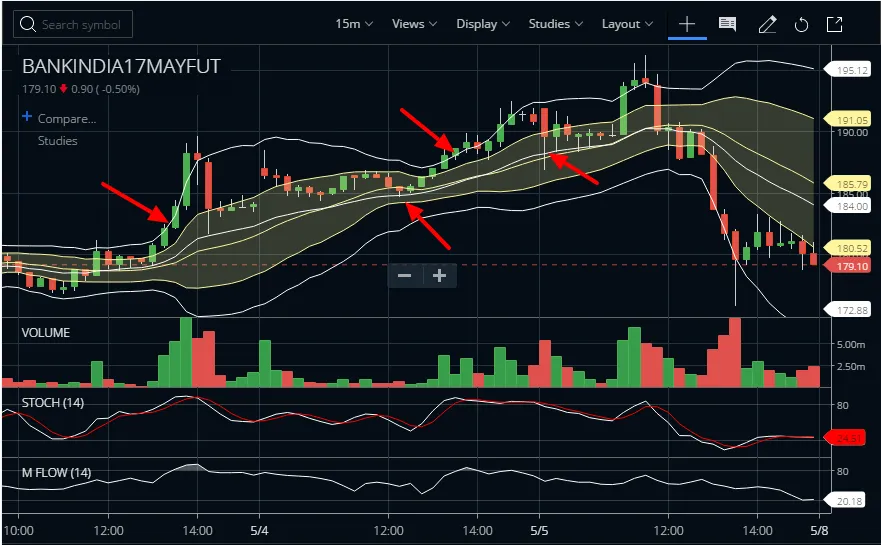
The trade log for these attempts is as follows:
- Trade 1: Bought at 182.10; Sold at 185.30. Profit of 3.2 points.
- Trade 2: Bought at 188.00; Sold at 187.50. Loss of 0.5 points.
Dissecting the Exit Strategy
A key question arises from the first trade. On 05/03 at 14:25, a large red candle appeared. Why wasn’t the position closed?
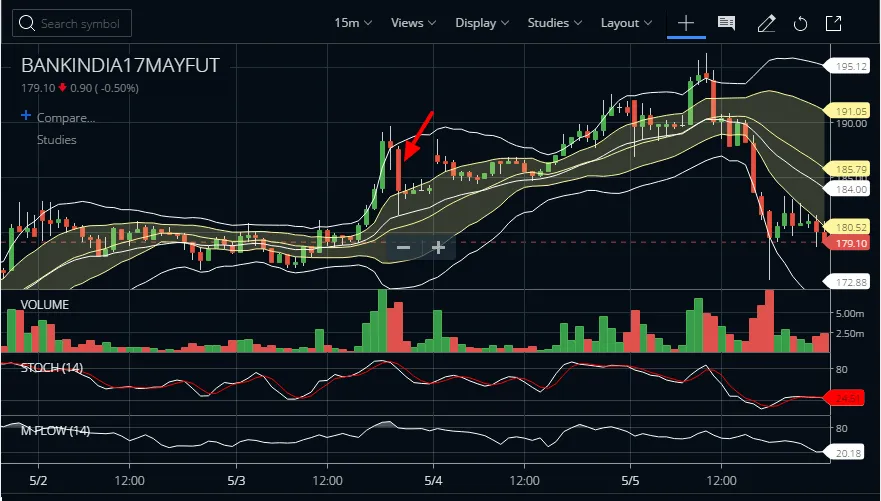
The exit rule for our BRS implementation is a price touch of the 20-period Simple Moving Average (SMA), which forms the median of the 1SD Bollinger Band. The red candle in question touched the 20-period Exponential Moving Average (EMA) but not the SMA. In volatile spikes, an EMA reacts faster because it gives more weight to recent prices. This can lead to premature exits from a potentially good trade.
A Failed Breakout and a New Opportunity
Following the BRS rules strictly, the next signal resulted in a loss:
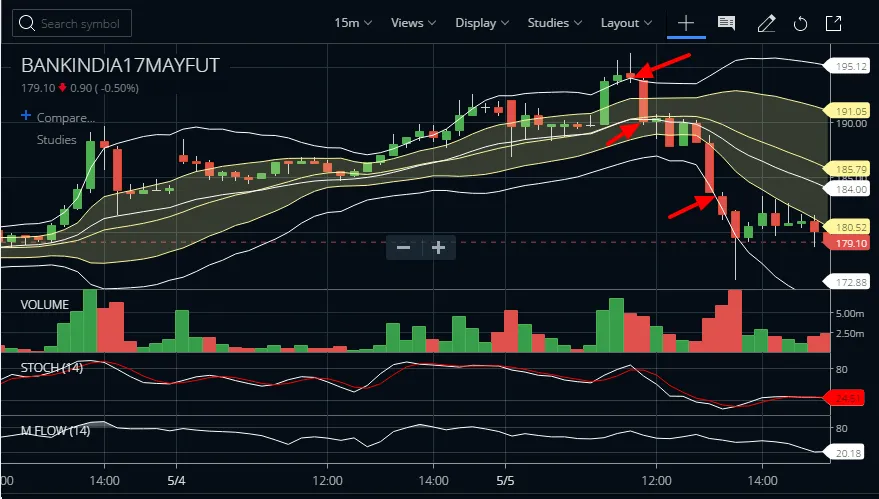
Here, a long trade was entered at 194.20, but the upward momentum failed, and the position was exited at 190.10 for a loss of 4.1 points. This highlights the inherent danger of breakout strategies on lower timeframes, where mean reversion is a frequent occurrence. However, this failure presented a different, more powerful setup.
The 3BB Strategy Short Signal
Notice that the candle at the entry point of the failed long trade (at 194.20) was a red candle that closed outside the 3rd Standard Deviation Bollinger Band. This is the precise entry condition for the 3BB Strategy, which is a mean-reversion strategy. It signals price exhaustion and a high probability of a reversal.
Instead of going long on a breakout, the correct trade was to go short based on the 3BB setup.
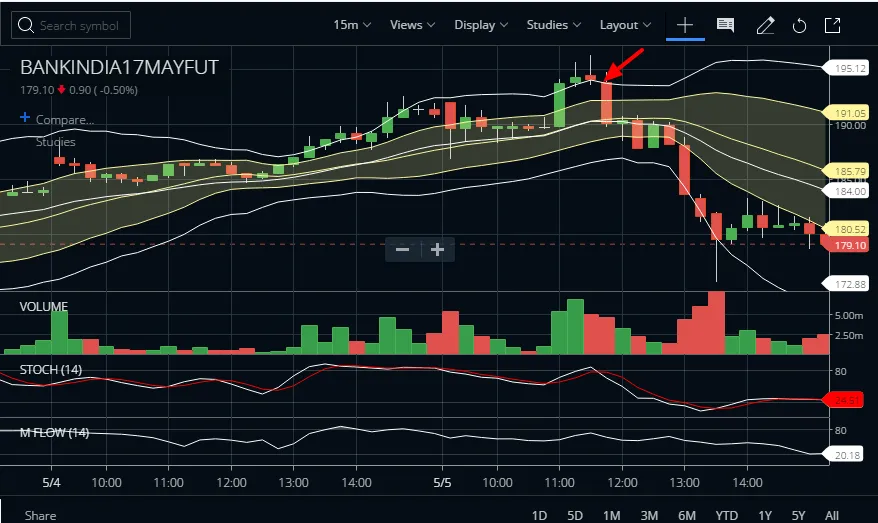
The 3BB trade was executed as follows:
- Shorted at 194.00 based on the 3BB confirmation candle.
- Covered at 179.20 at 15:29, as per the intraday rule to close all positions before market close.
This trade resulted in a profit of 14.8 points.
Why Waiting for the 3BB Signal Matters
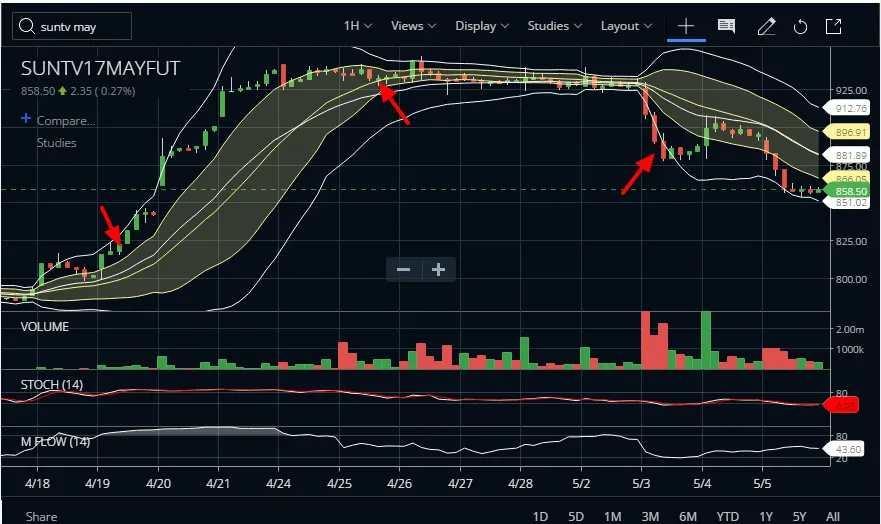
The 3BB strategy is named specifically because it requires a candle to close beyond the 3SD band. It is not a 2BB, 4BB, or 5BB strategy. The 3rd standard deviation represents a statistical extreme, making a reversal more likely than a continuation. The image below from a SunTV Futures chart further illustrates why we do not exit based on simple price action but wait for a confirmed setup like the 3BB.
Takeaway
This case study demonstrates the importance of selecting the right strategy for the market condition and timeframe. While the Bollinger Ride Strategy failed in the choppy, low-timeframe environment, the market offered a textbook 3BB mean-reversion setup. The key is to recognise the statistical extremity signalled by the 3BB and act decisively with a clear exit plan.