Analyzing Bank of India with Bollinger Bands Trading Strategy
BRS Strategy in Bank of India
Here are the first two trades in the given scrip using Bollinger Bands Trading Strategy –
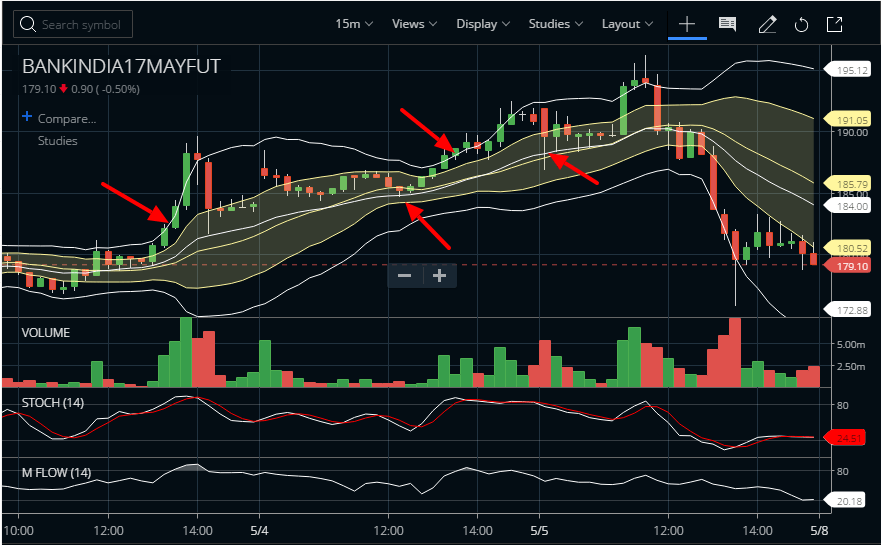
- Bought at 182.10; Sold at 185.30. Profit of 3.2 points
- Bought at 188; Sold at 187.5. Loss of .5 points
Bank India is already a high beta script but still taking a 15-minute time frame creates so much noise.
So the higher the time frame for this strategy; the better. We already know this Strategy – Bollinger Ride Strategy (1SD – MA, 2SD – EMA)
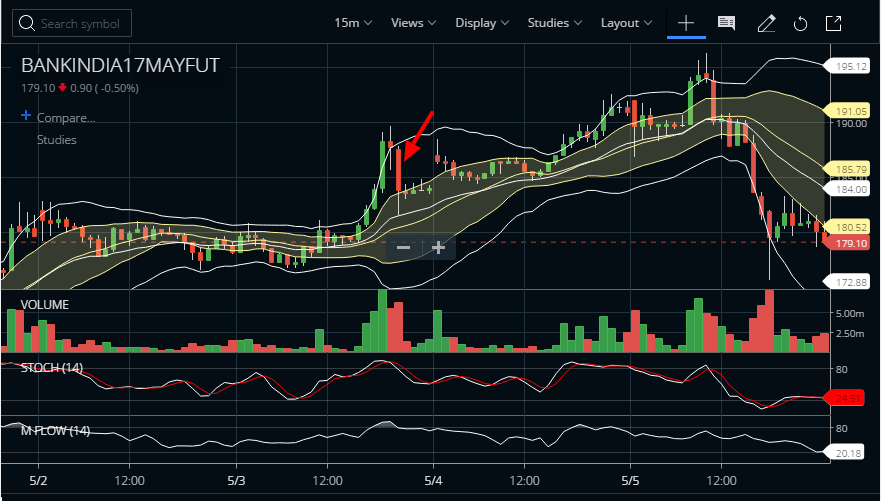
Q. On 05/03 at 14:25 there is a huge red candle. Why didn’t we close our first trade there?
A. The red candle did not touch the median of 1 SD Bollinger though it touched the median of 2 SD Bollinger. (Refer above picture). EMA acts weird in volatile spike as it takes more weight of recently formed candlesticks. That’s why I rely on SMA as my exit strategy rather than EMA.
So you can also devise the vice versa method of spotting downtrend and generate a sell signal. However, if you do not consider the case of 3BB there are two trades –
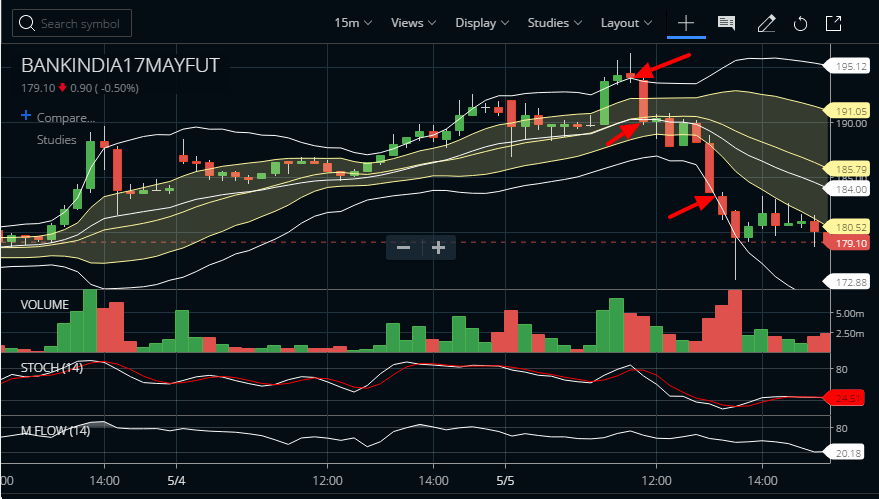
Bought at 194.20 Sold Exit Complete at 190.1. Loss of 3.1 points
Sold at 188.05
As you see the first trade went to loss.
The following sell trade is as of now open. This strategy is extremely dangerous (so is all breakout strategies) in lower time frames as mean reversion happens most of the time. So you need to be highly alert if you choose a lower time frame to day trade.
3BB Strategy in Bank of India
Additionally, it’s important to observe that the 3rd candle, the point at which we entered the trade, is a red candle, aligning with the parameters of the 3 BB strategy setup. By complementing this approach with the price action method for implementing stop losses, as demonstrated in the live example of Titan May Futures,
Then here is your trade –
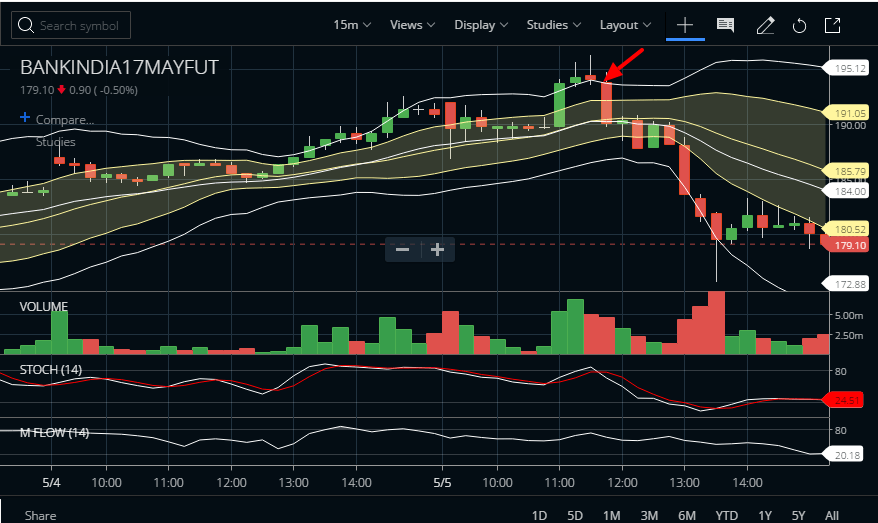
Here we have sold at 194 and closed at 179.20 (Because as said earlier, in our day trader setup we close on 15:29)
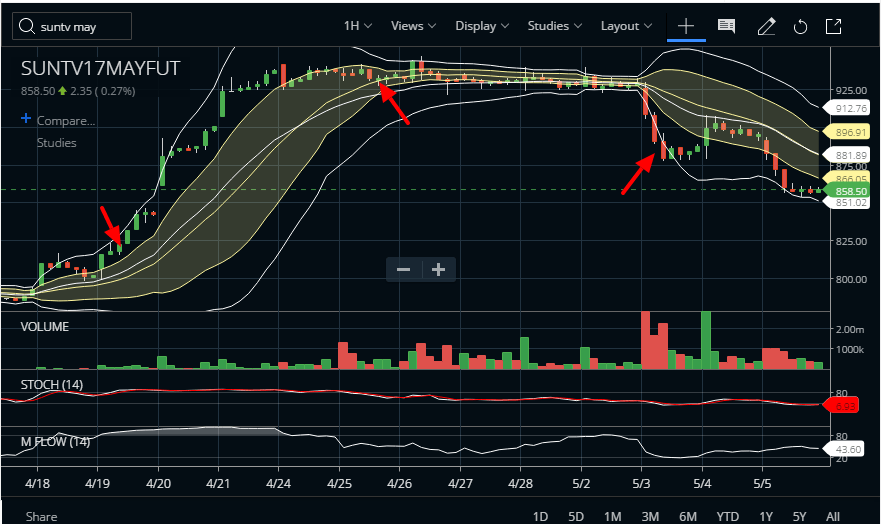
Here is one more setup with SunTV May Futures. Here you can see why I call the name 3BB instead of 4BB and 5BB. Also, you can see the reason why we are not exiting based on price action unless the trade setup led us to a 3BB opportunity.
